March 2026 - Water Consumption
Our monthly reports show the latest trends in water consumption data and placing these in the context of the DMDO’s business model, which is to share in the revenue generated from the sale of water to cover its operating expenses and repay investment.
The report shows data from district to household.
Any questions or feedback, please contact me, Victor William, at victor80.vw@gmail.com.
1. Lindi District Water Operator (CBWSO) Data
Piped Water Consumption in relation to weather condition in Lindi:
There are some insights to learn.
In general, the March report shows low consumption of piped water. This is due to very high rainfall in the region, this is also expected in April being the high rainfall season. There is very high drop in average consumption for CBWSO and water systems depending highly on public taps while CBWSO with high number of Household connections experiences low slowdown during rainfall season.
This have implication in revenue collections which reflects the ability to recover the investment costs and returns in water investments. This is potential for the DMDO and private capital investors in WASH, as it informs that with expected revenue drop in rainfall season can be worked on by ensuring high number of household connections.
During rain season customers with water at the door steps don’t struggle to fetch rain water but for households fetching water from the public taps which is usually distant from their homes in the village premise they usually use the opportunity of rainwater which in turn affects the revenue collections and household health.
This is evidenced by CHIUWE CBWSO with very high number of household connections of about 2200 HHC showing maintained consumption from February to March despite of high rainfall where other CBWSO shows continued dropdown in piped water consumption.
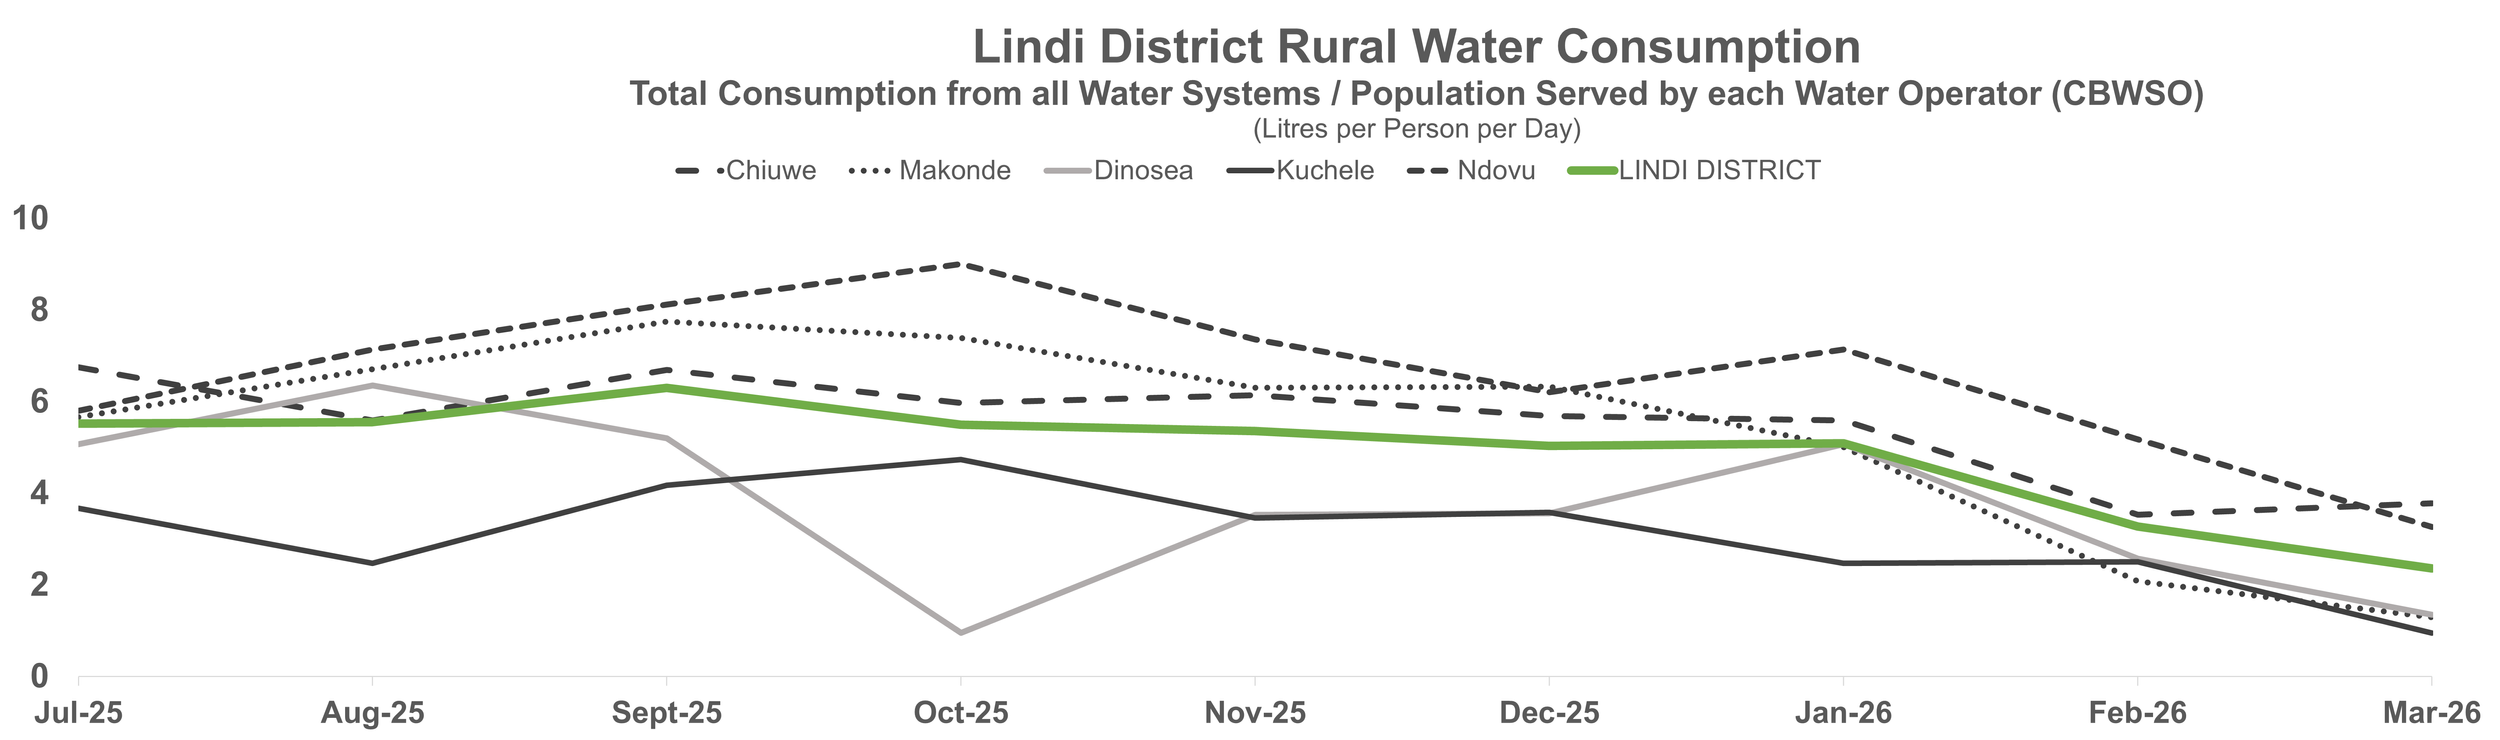
Lindi District Rural Water Consumption: Comments & Observations
There is a drop in consumption almost in all CBWSOs, the main reasons being high rainfall season which is considered in financial projections , but we see CHIUWE CBWSO slightly maintaining the consumption, this is due to having very high number of HHC compared to other CBWSOs.
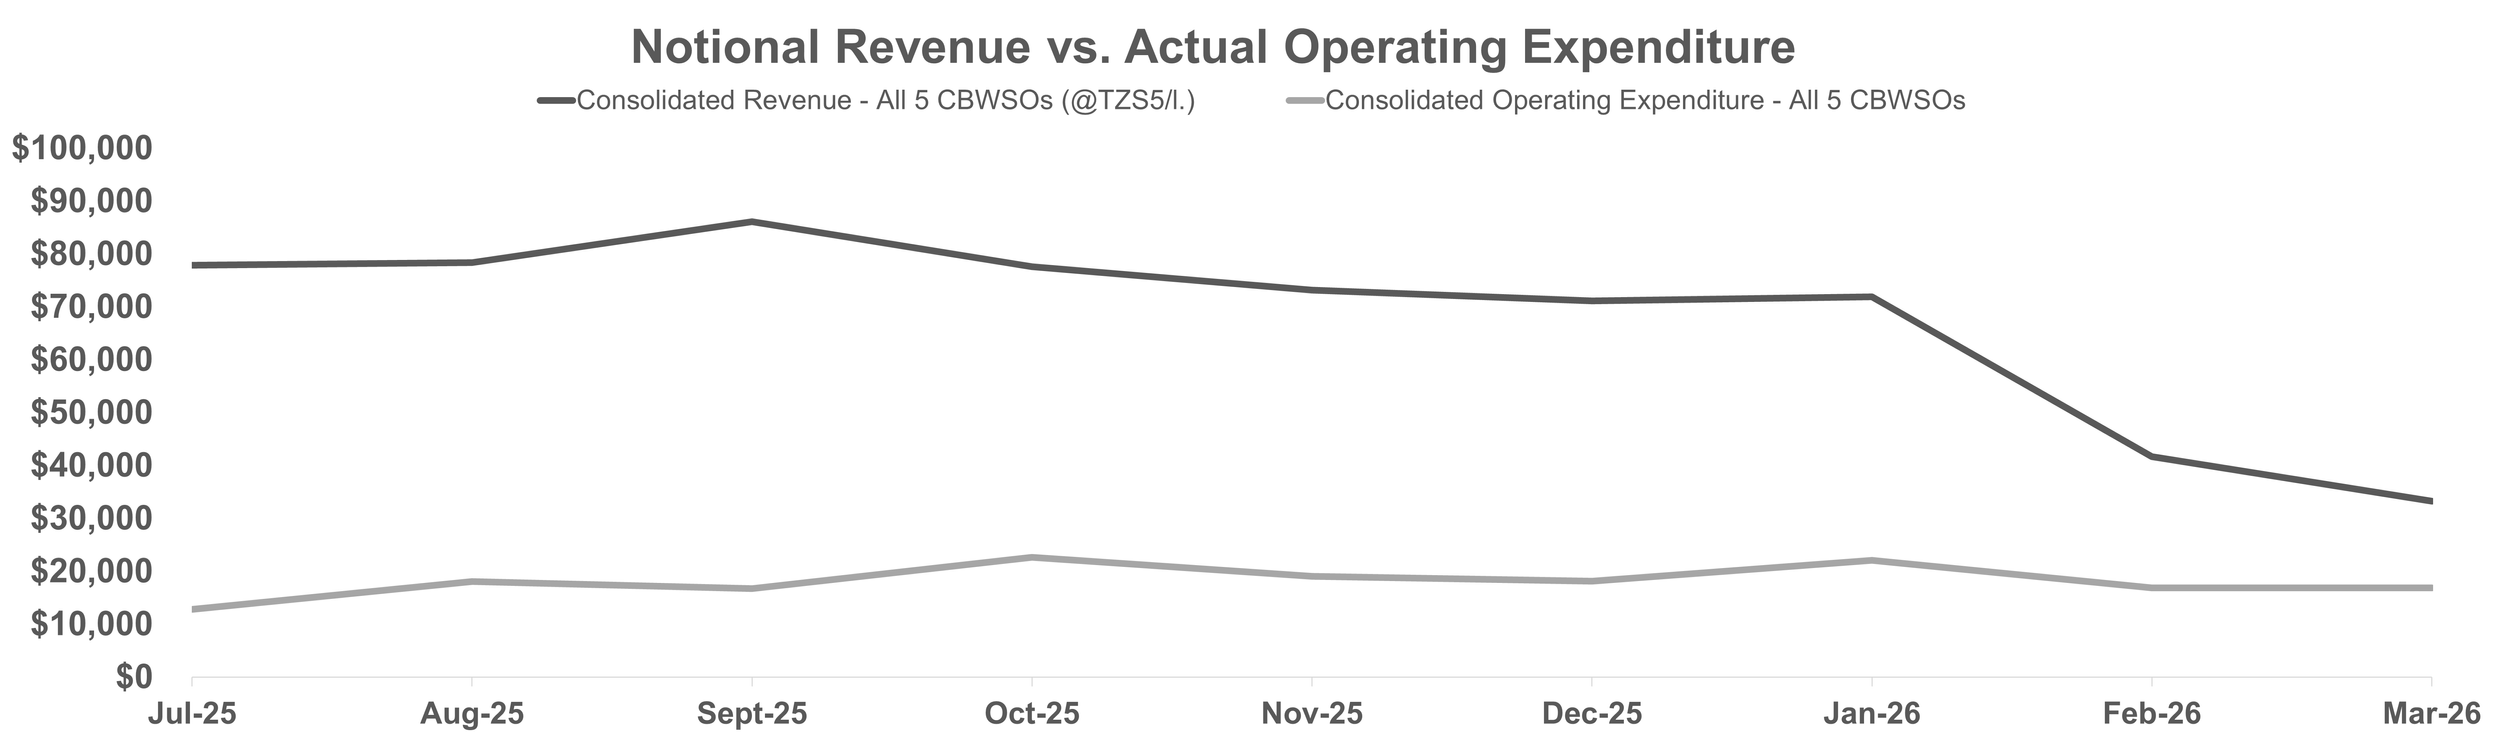
Notes on Water Operator Revenue vs. Operating Expenditure
The graph shows is below the revenue collections which provides the picture that the CBWSO has the ability to recover the investment costs or can do returns in the investment and debt service payment is possible.
Revenue not ‘actual’ - calculated by litres consumed x TZS5 / litre.
TZS5 / litre is not current price but the affordable price that DMDO business model relies on.
DMDO business model assumes suplus used for:
Water Operator service improvement;
DMDO (a.k.a. Rural Water Intermediary) Operating Costs; and
Return-Seeking Investor in Water Supply Infrastructure.
Current Problem is Low Price and Revenue Loss
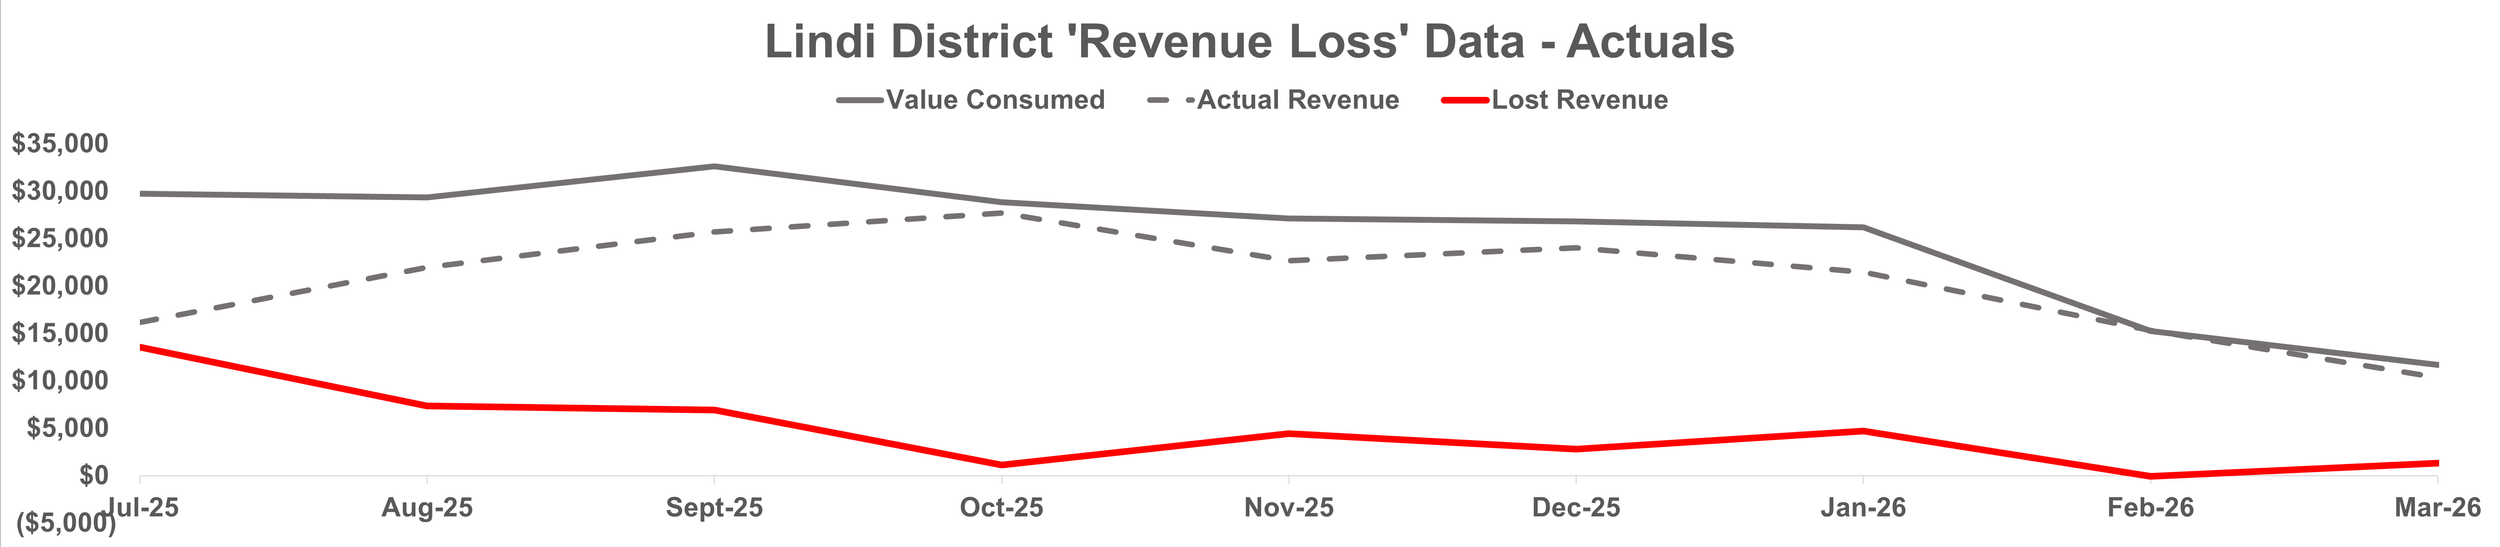
Digitization of Water Supply (through Prepaid Metres) addresses Revenue Loss problem.
The red line presents revenue loss which is commonly named unpaid water bills. This means bringing all water systems to DMDO standards with digitized infrastructures will solve the current main problem of revenue loss. This efforts requires more investment for improving the water systems.
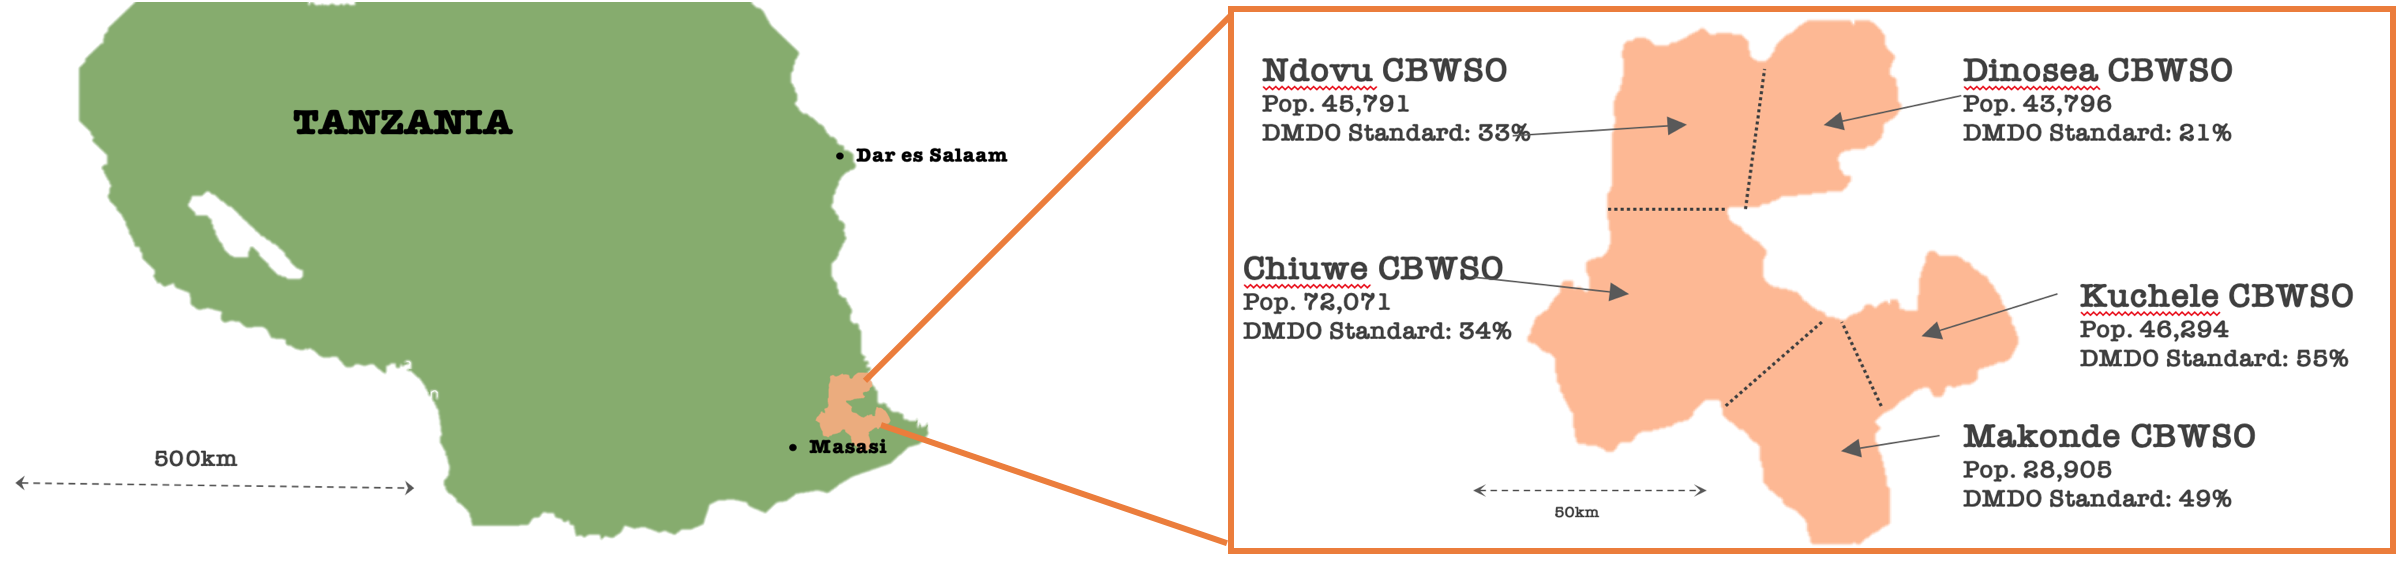
2. DMDO Footprint Data
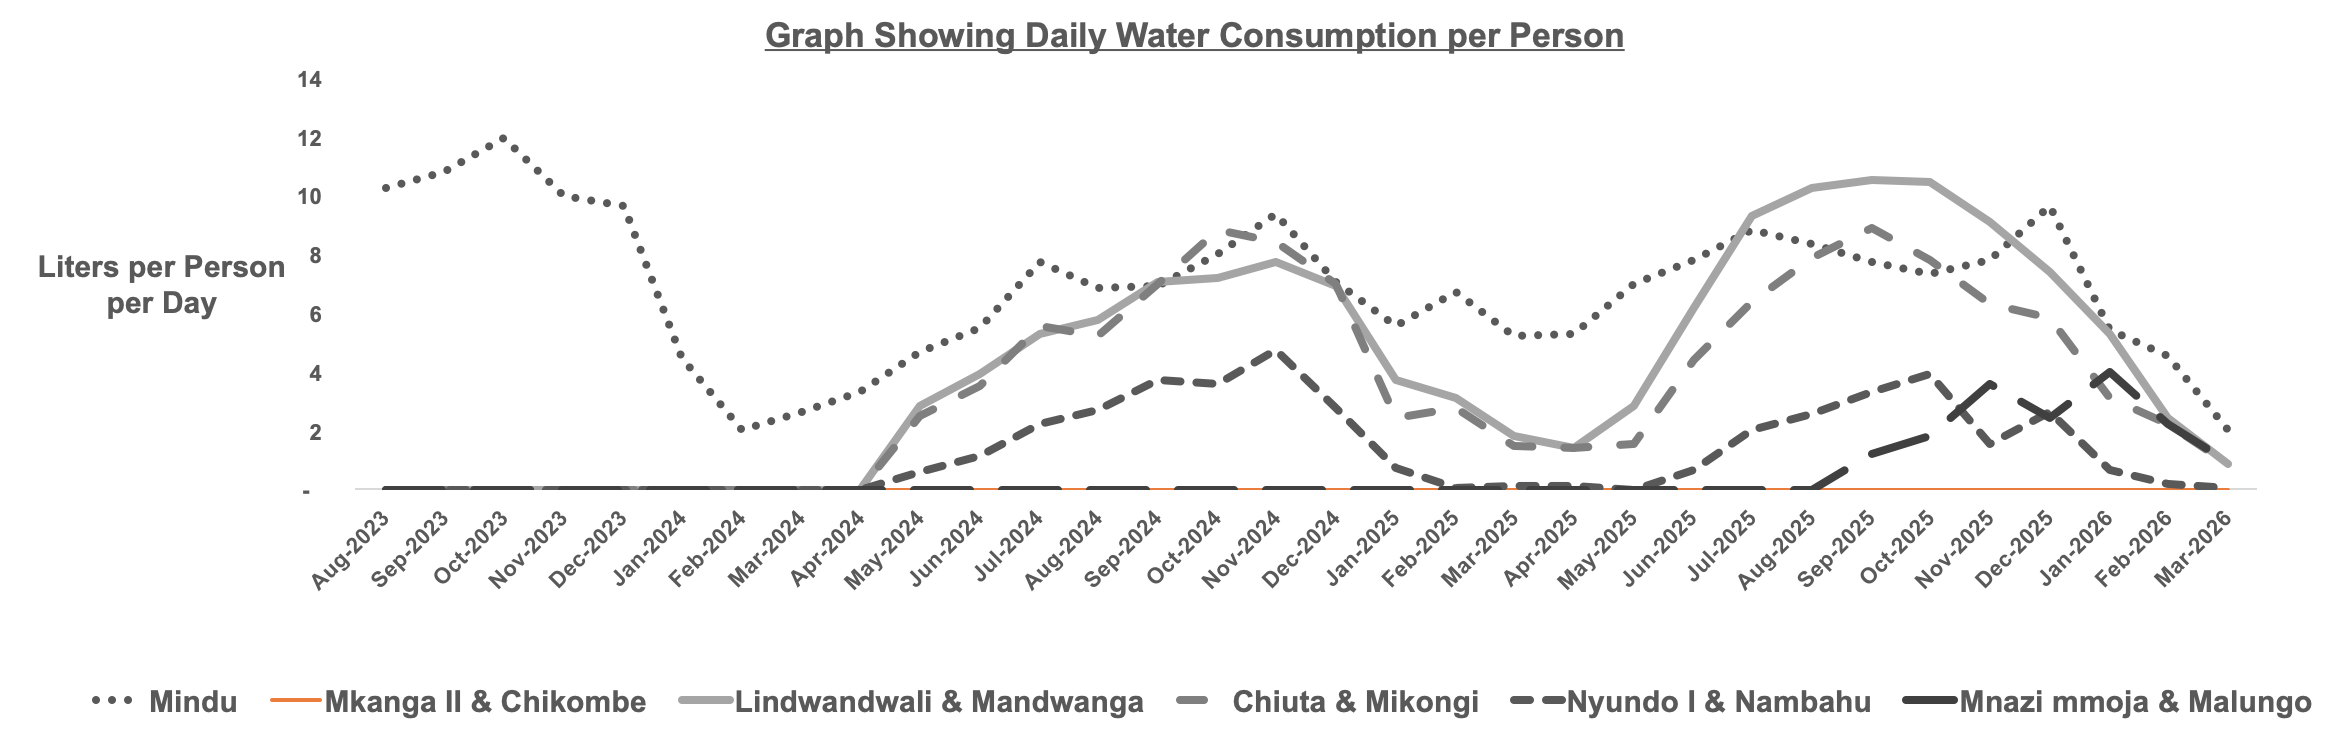
DMDO Footprint Data - Comments & Observations
The DMDO in partnership from World Vision Tanzania with Funds from The Grille Foundation has invested water systems to DMDO standards that is “Basic access to clean, safe, and reliable water services delivered through digitised infrastructure.”
Lindwandwali & Mandwanga Water System - The consumption of piped water has gone down due to heavy rainfall, that majority are consuming rain water and are spending less time at home for farming.
Nyundo 1 & Nambahu Water System - Majority opts for rain water as the piped water is salty. The DMDO is in the final processes improving water quality by using Mikongi water source, which has fresh water. Procurement of service providers has been done the construction is upto start as suppliers are delivering materials but being constrained by transport to villages due to high rainfall
Chiuta & MikongiWater System - The consumption of piped water has gone down due to heavy rainfall, that majority are consuming rain water and are spending less time at home for farming.
Mnazimoja & Malungo Water System: There is high drop down as majority in the water system depends on public taps in which during very high rainfall the trends of fetching piped water is down
Mindu Water System: seasonal rainfall still reduces piped water consumption. The system still shows the use of piped water despite of very high rainfall because the majority are now used to piped water with more than 4 years where their preference of rainwater has increased. Other systems are still new which is linked to behavior changes that takes some time.
3. Household Connection Data
The DMDO has installed prepaid meters at 8 households in 4 villages within 3 Water Systems. These are pilots to show that consumption is much higher in household connections. This supports a financial product in which the household connection can be financed and that debt serviced out of revenue from increased consumption.
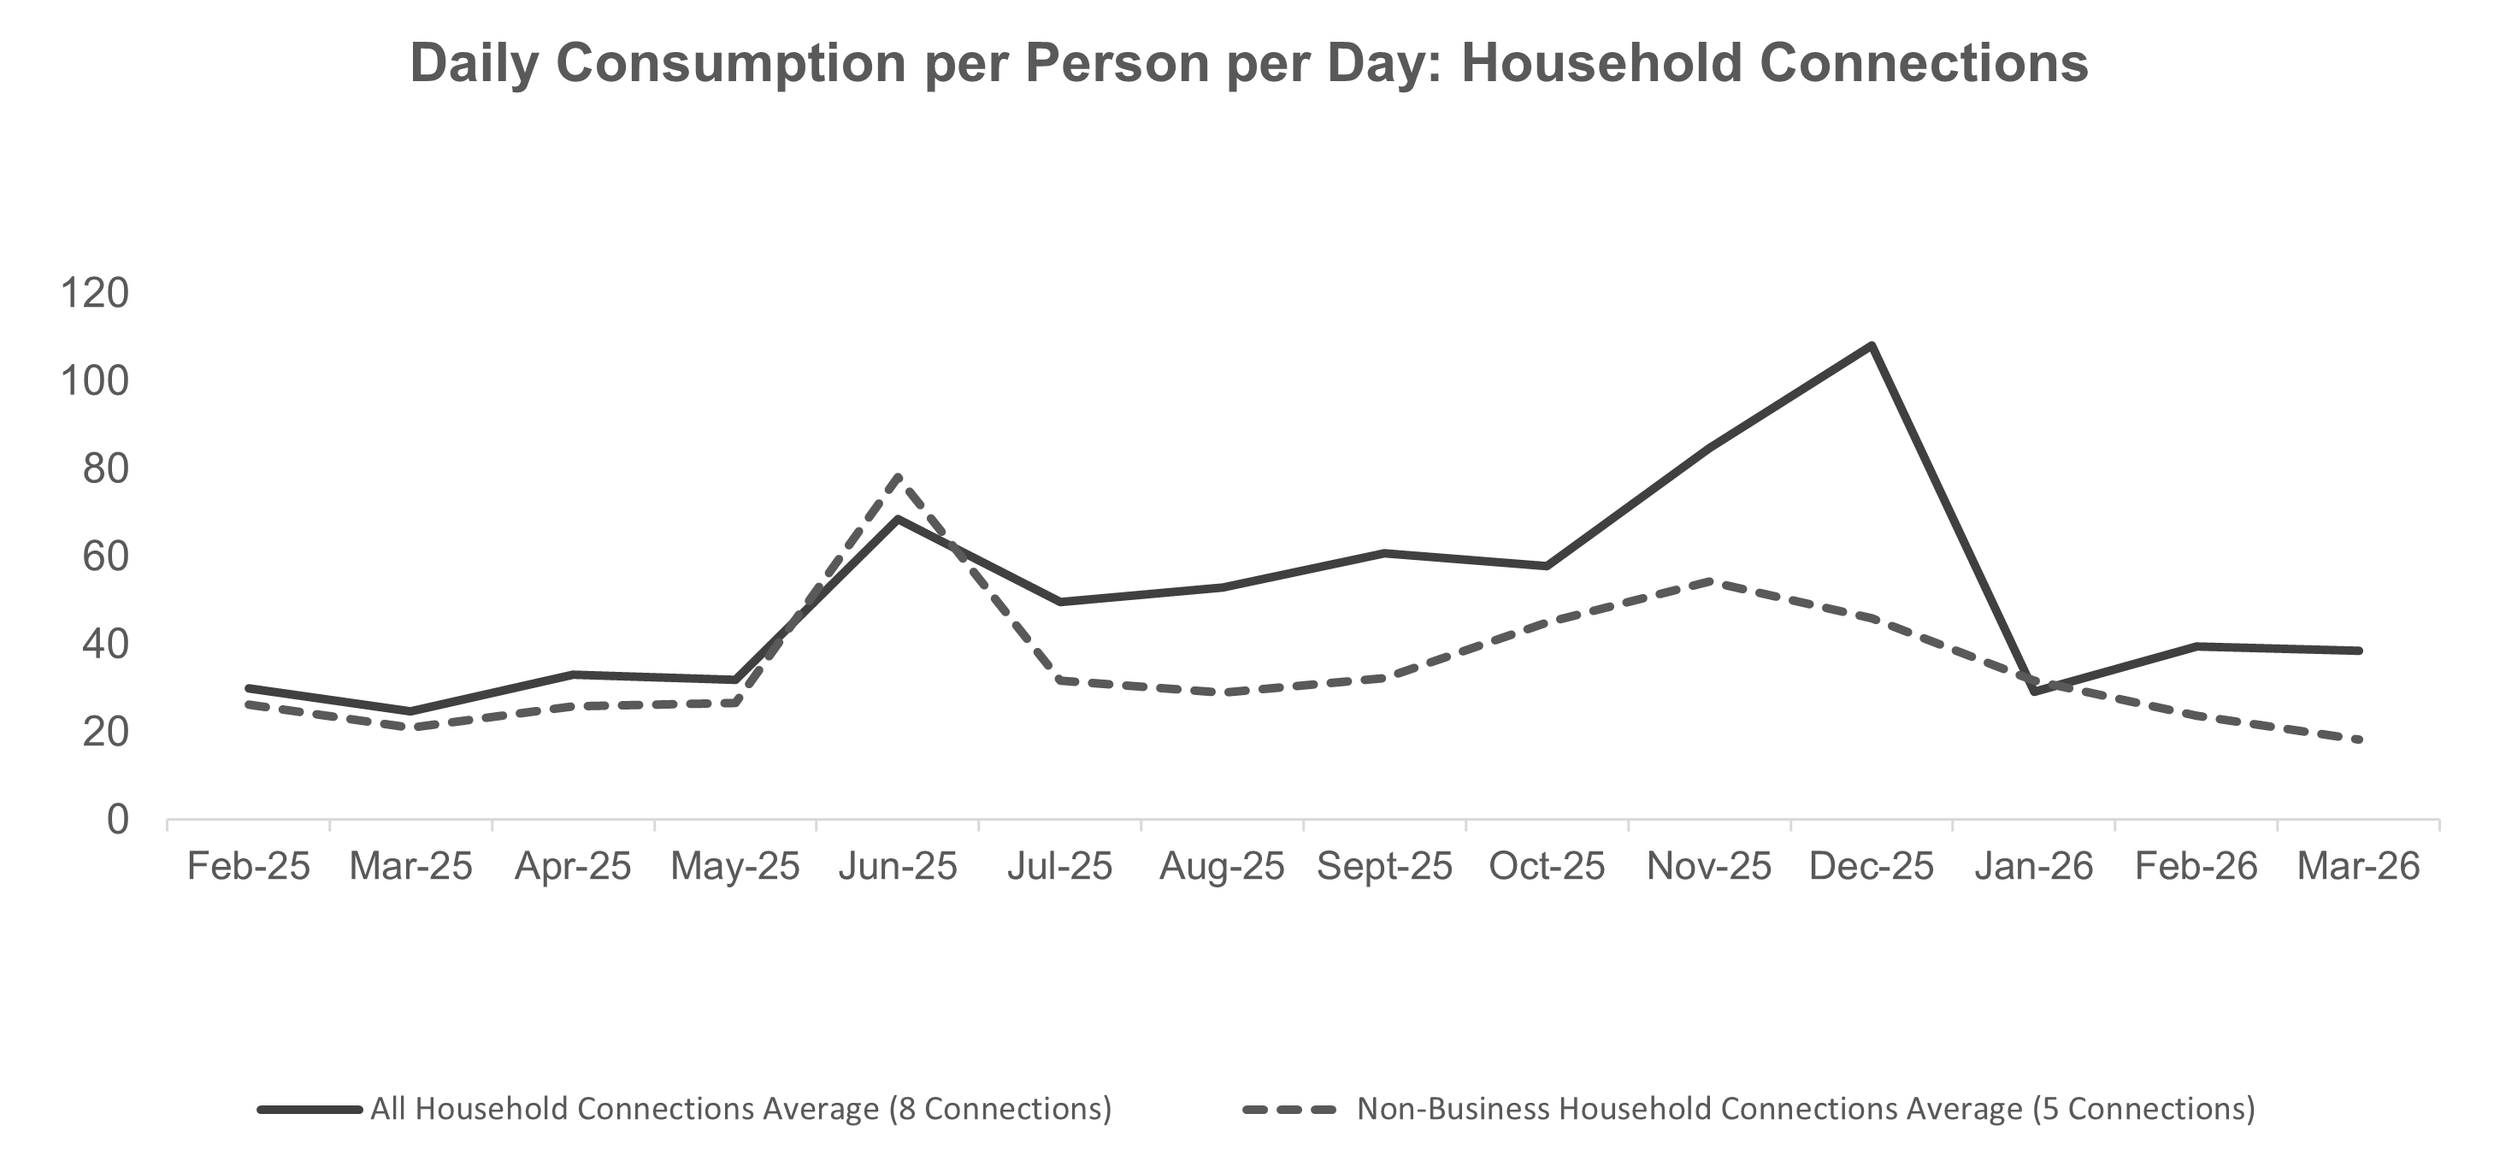
Household Connection Data - Comments & Observations
There is a drop in HH water consumption of piped water in March compared to dry season months due to very high rainfall. The average of about 20 litres per person per day is very high comparing to the ones HH using public taps which is at the average of 2 litres per day per person . Therefore, HH connection still shows high water consumption compared to accessing water from public taps.
Nonbusiness customers consumption dropped in march, meaning that HHC with business activities are potential for consumption and revenue generations.
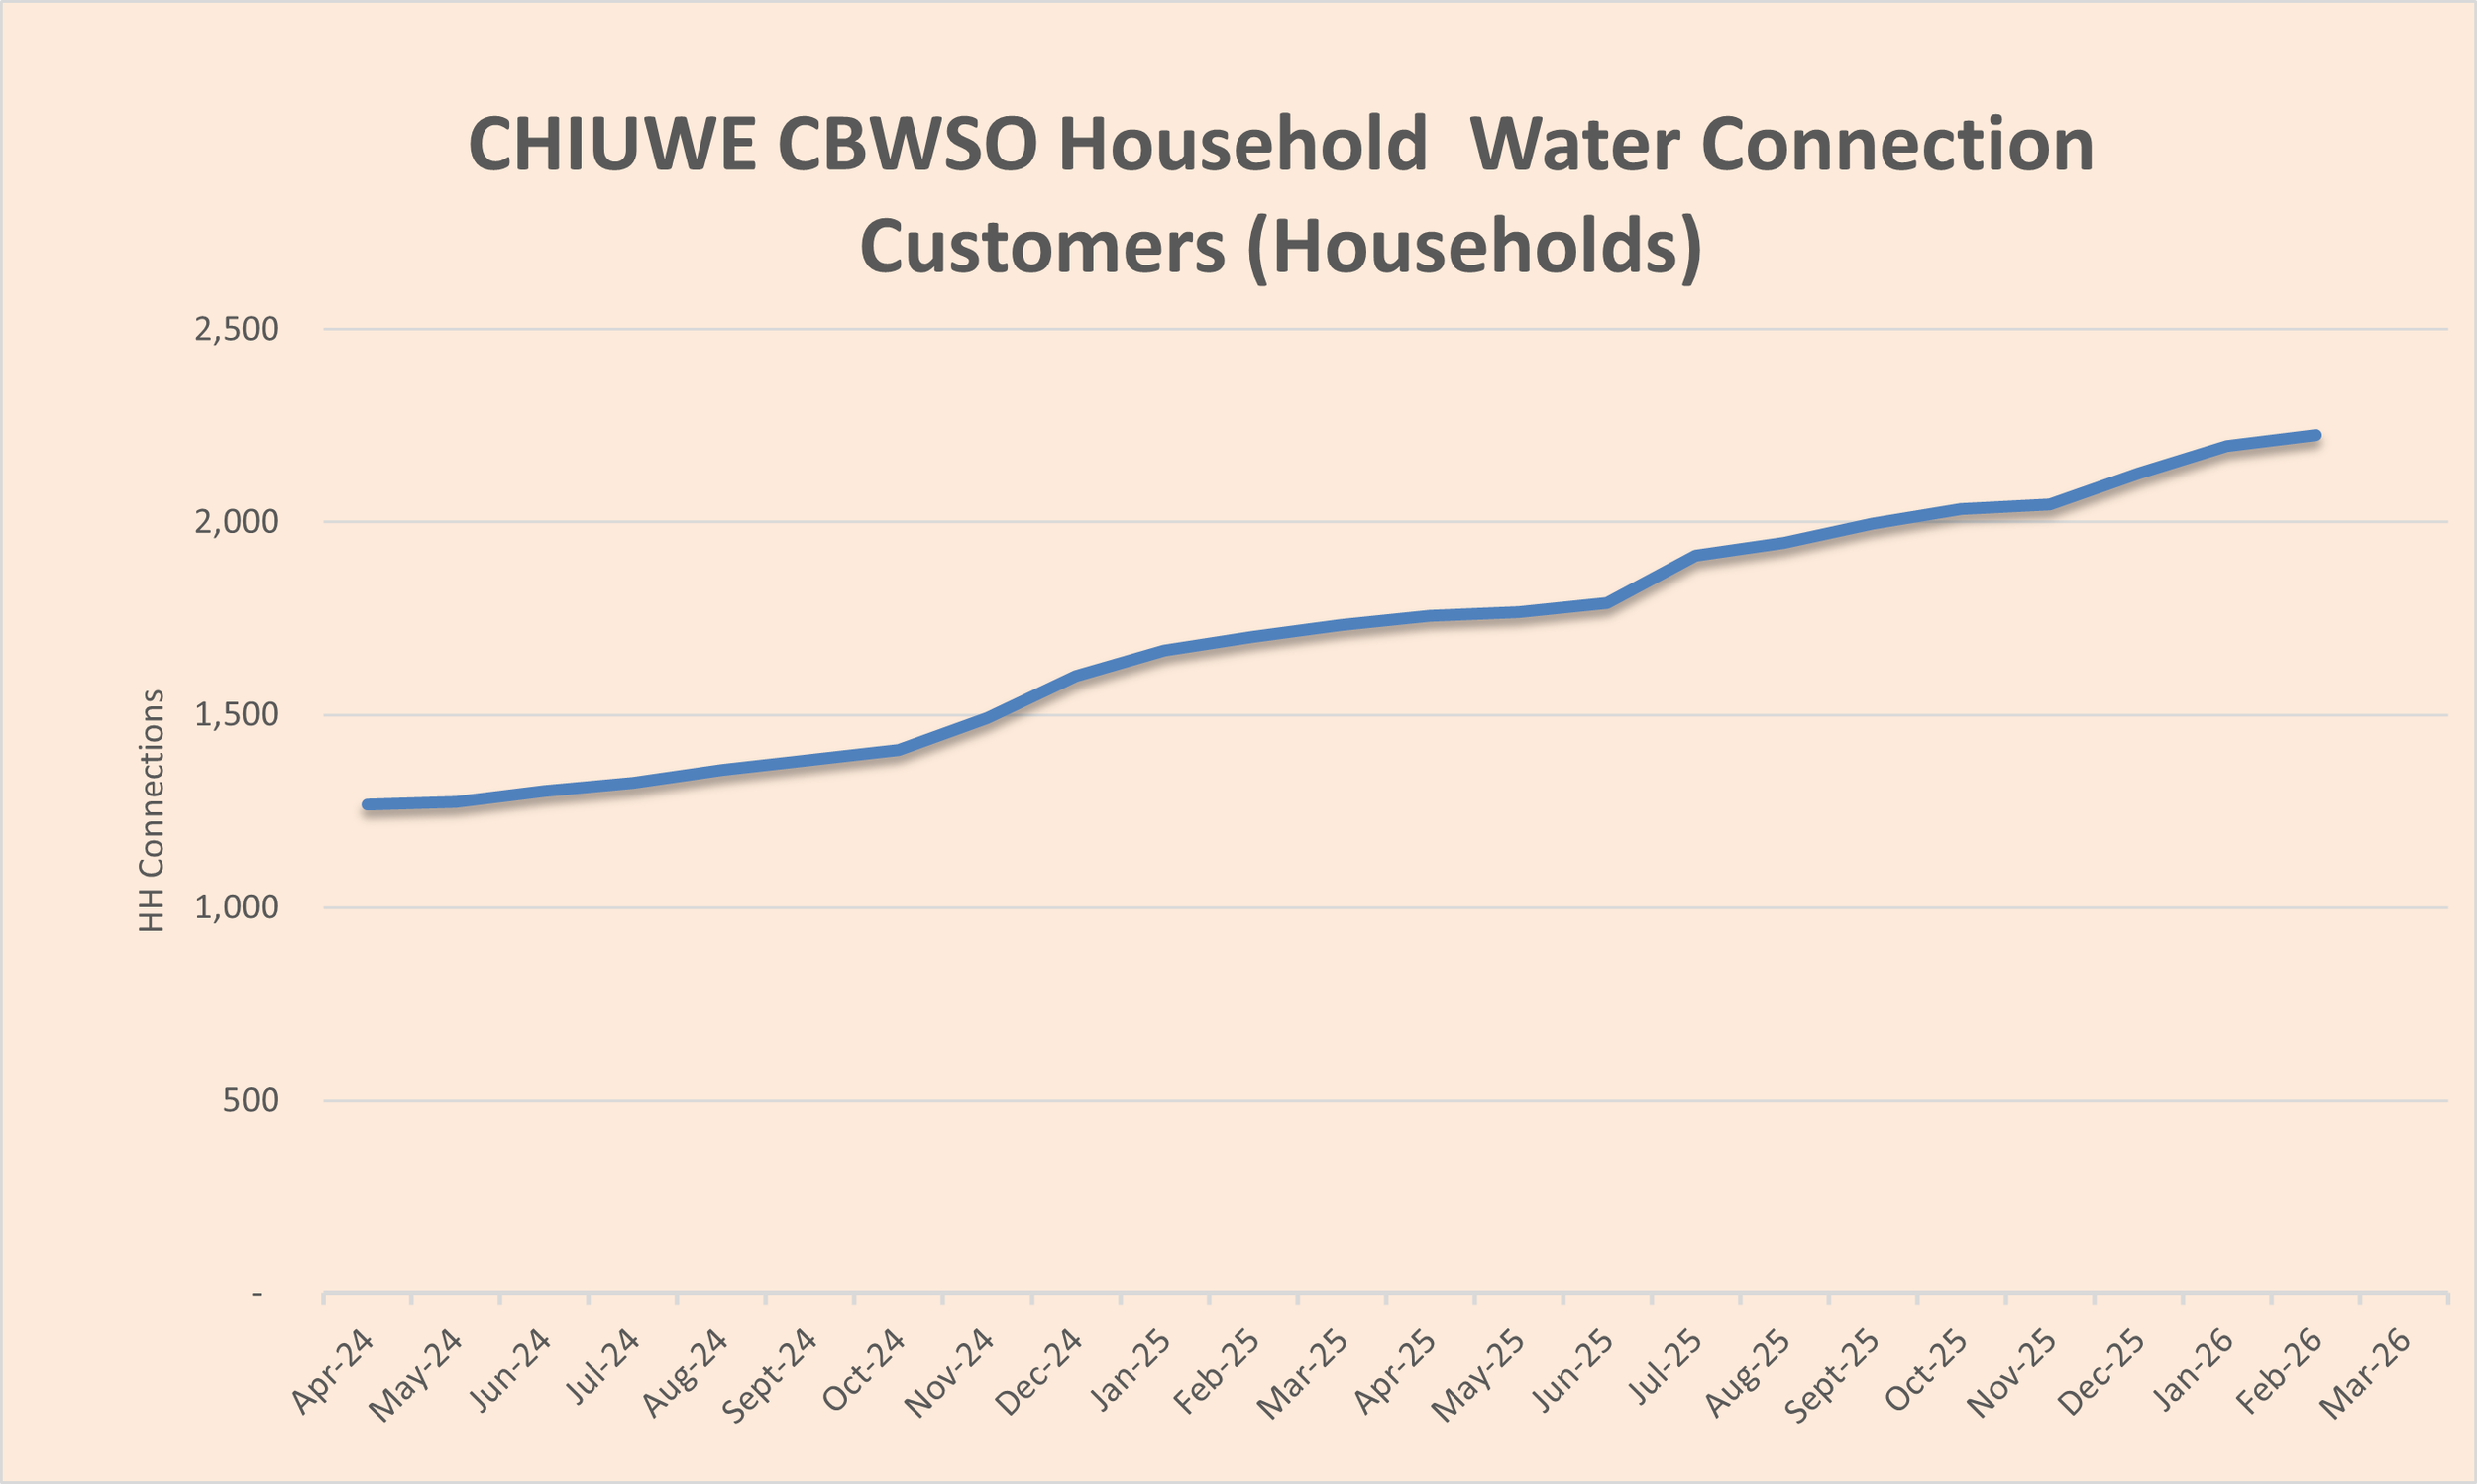
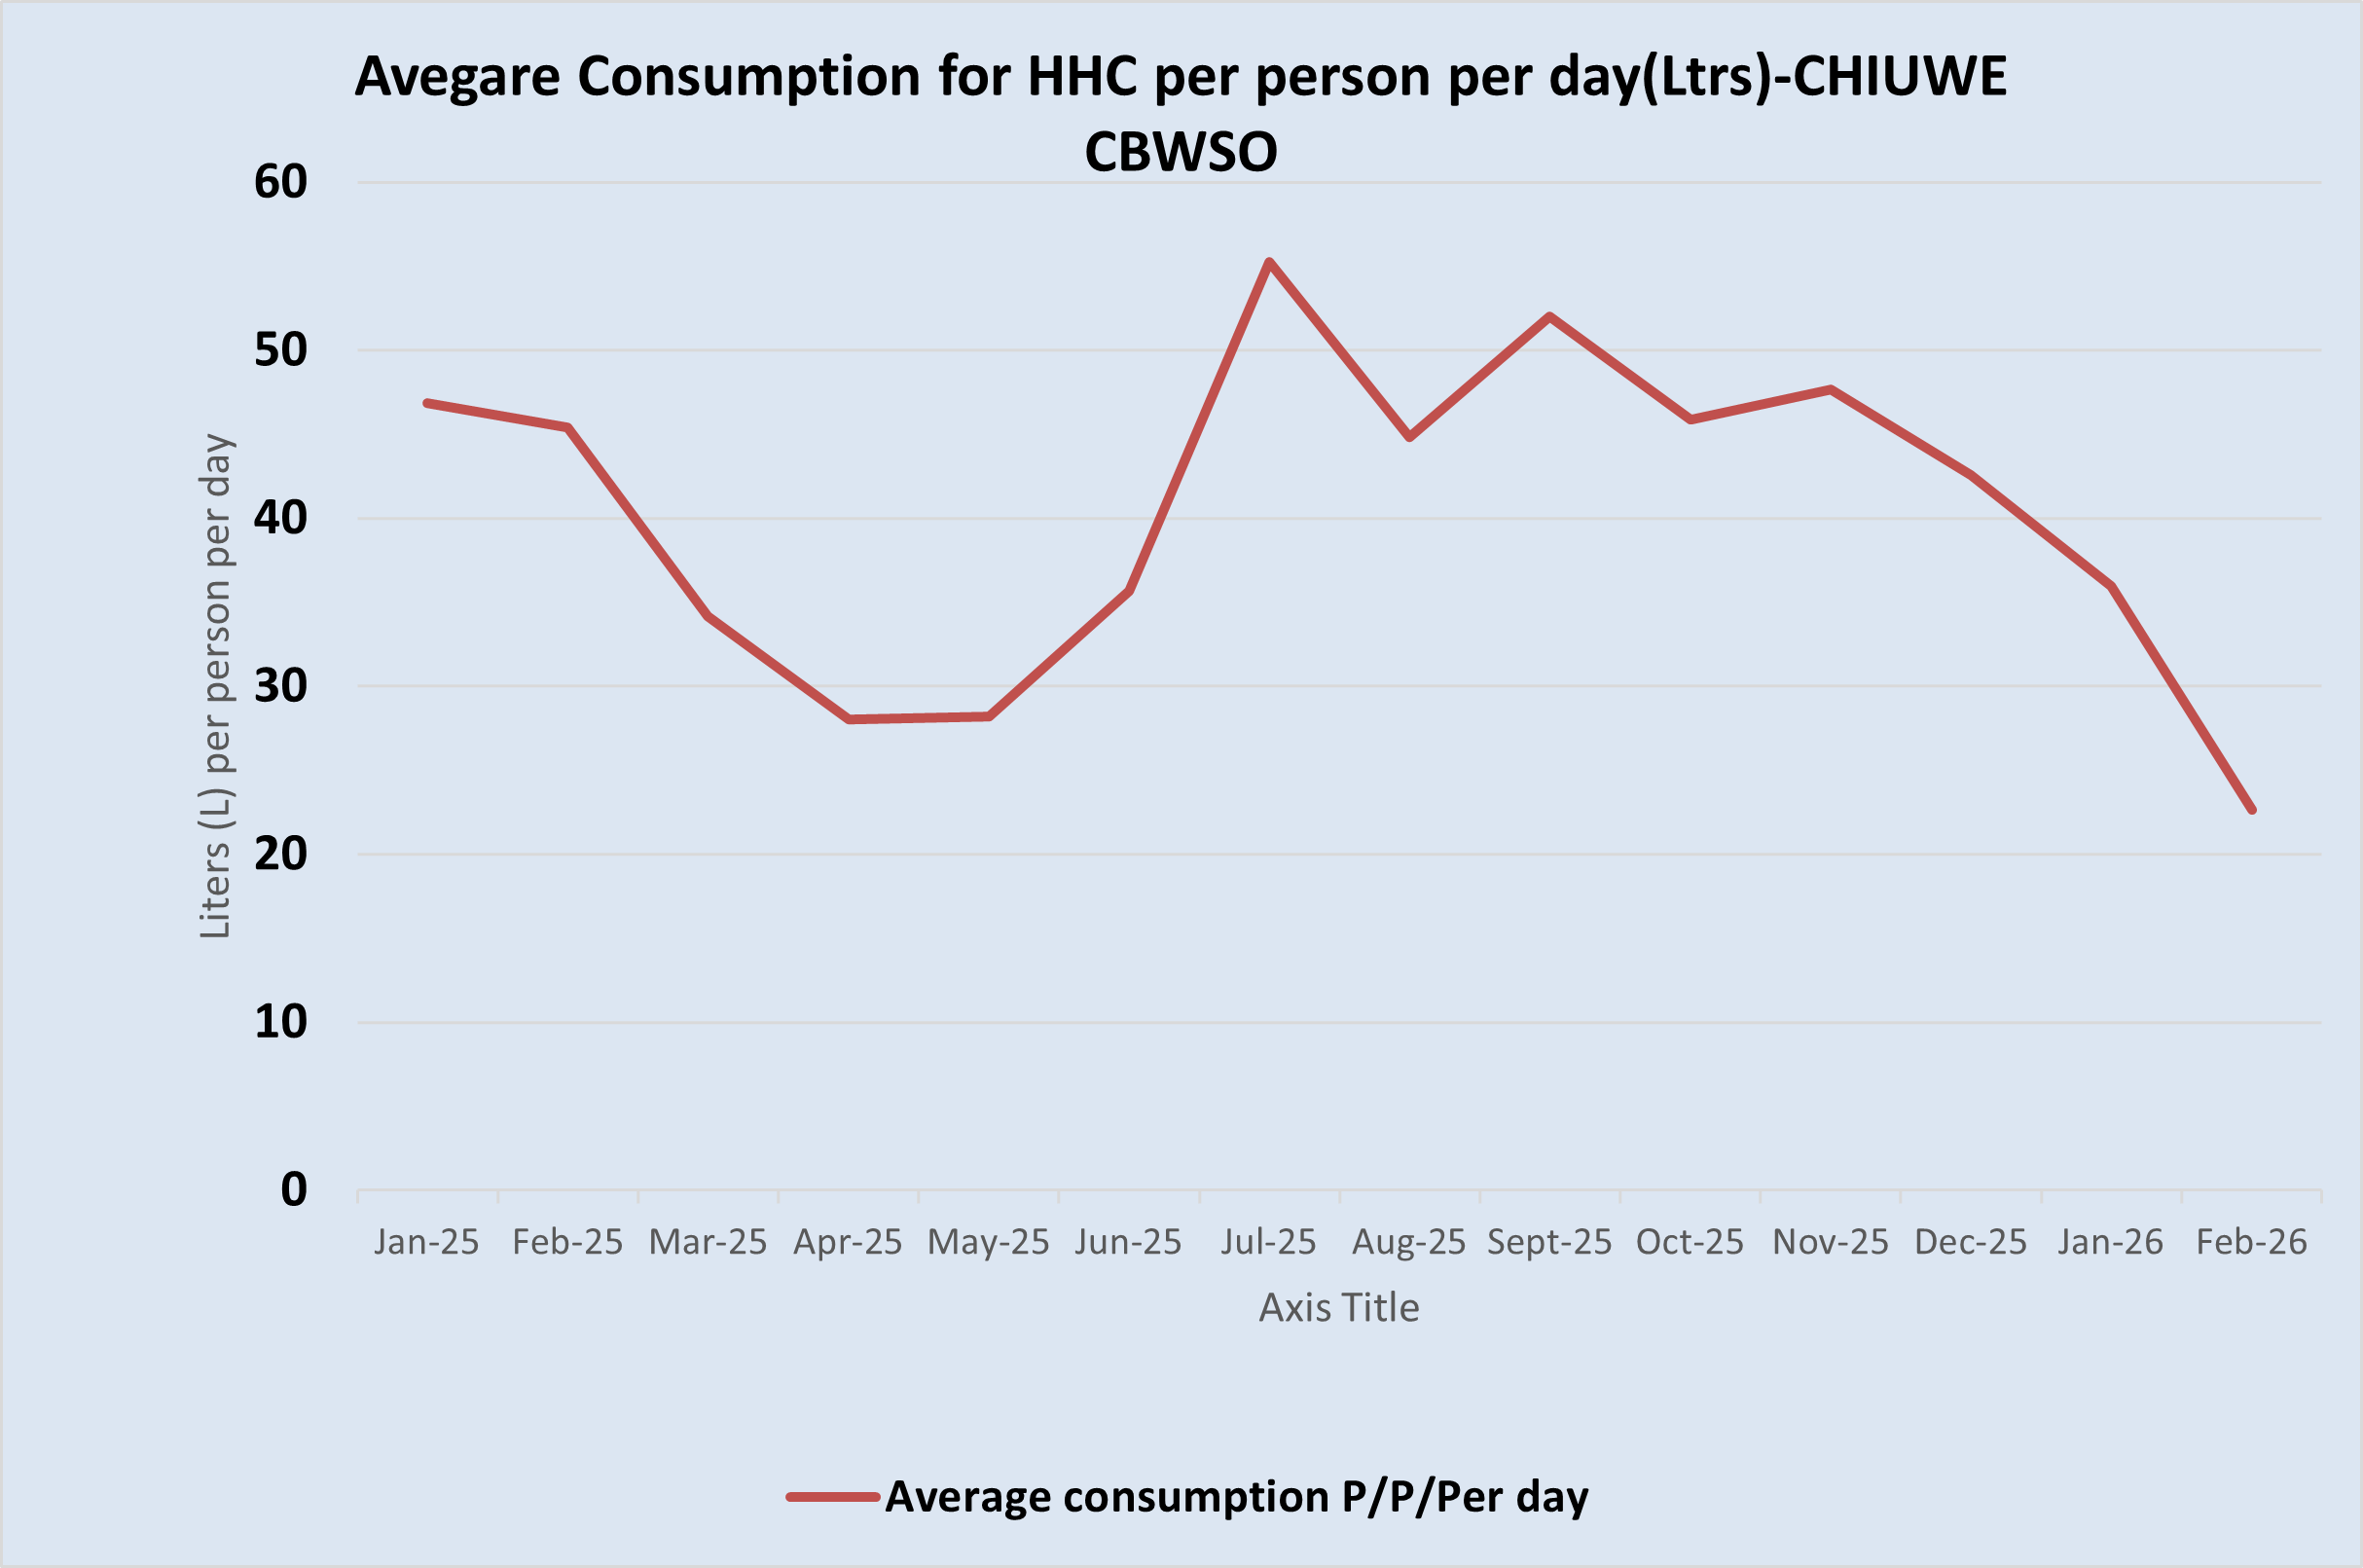
CHIUWE CBWSO Household connection data
First graph The data shows increasing high demand of HH connections as from January 2024 the number of new customers increased from about 1300 to 2200 in 2026 where Households are covering all costs of water connections including pipeline , meter and fittings (postpaid billing systems).
The second graph shows average consumption raises to 50liters per day per person in dry season and around 20liters per day per person in wet season which is promising for investing in Household water connections
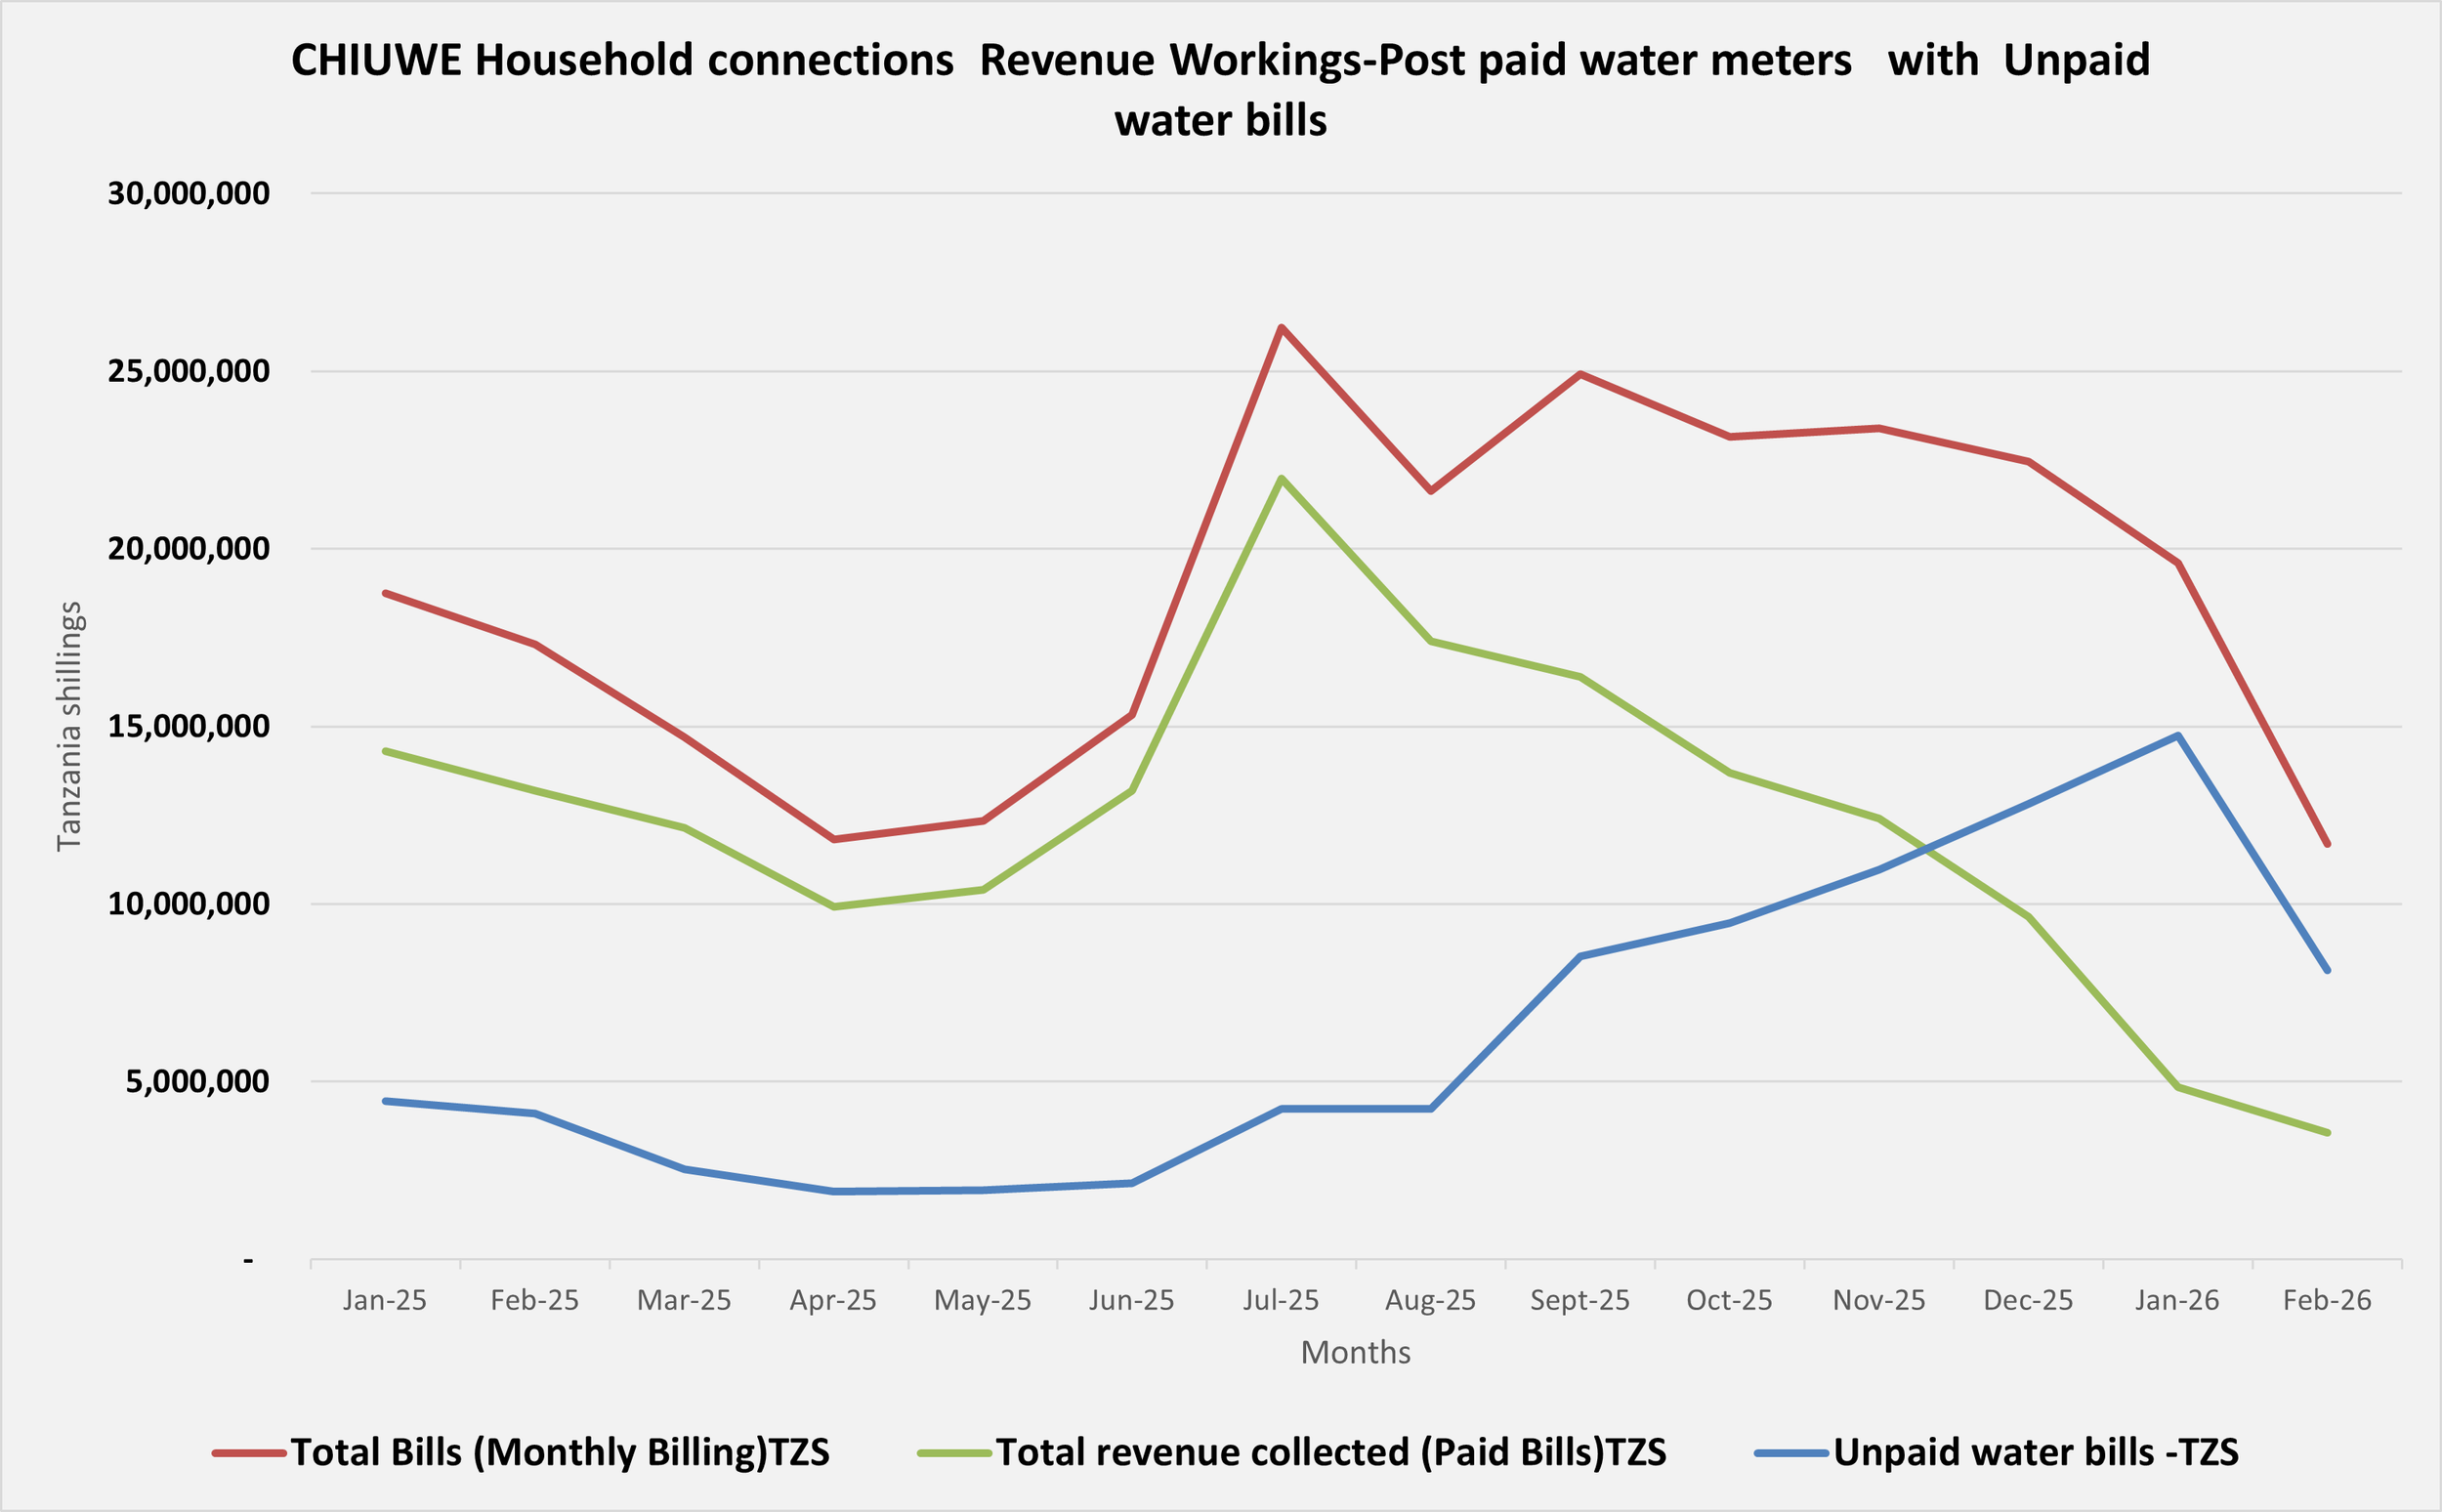
Third graph , Shows the need for digitized technologies that is prepaid water meters as the all 2200 HHC uses postpaid meters , meaning that they consume water and then pay bills at the end of the month. This shows the trends of unpaid water bills on every month. This affects revenue collection, CBWSO operations and affects returns . Therefore, bringing the systems to DMDO standards with digitized infrastructures for HHC with prepaid water meters means 100% collection of revenue.
With traditional manual meters, the trends of unpaid water bills prevails where on monthly basis all water bills are not paid where for Households with prepaid water meters piloted in Makonde CBWSO proves all water consumed being paid.
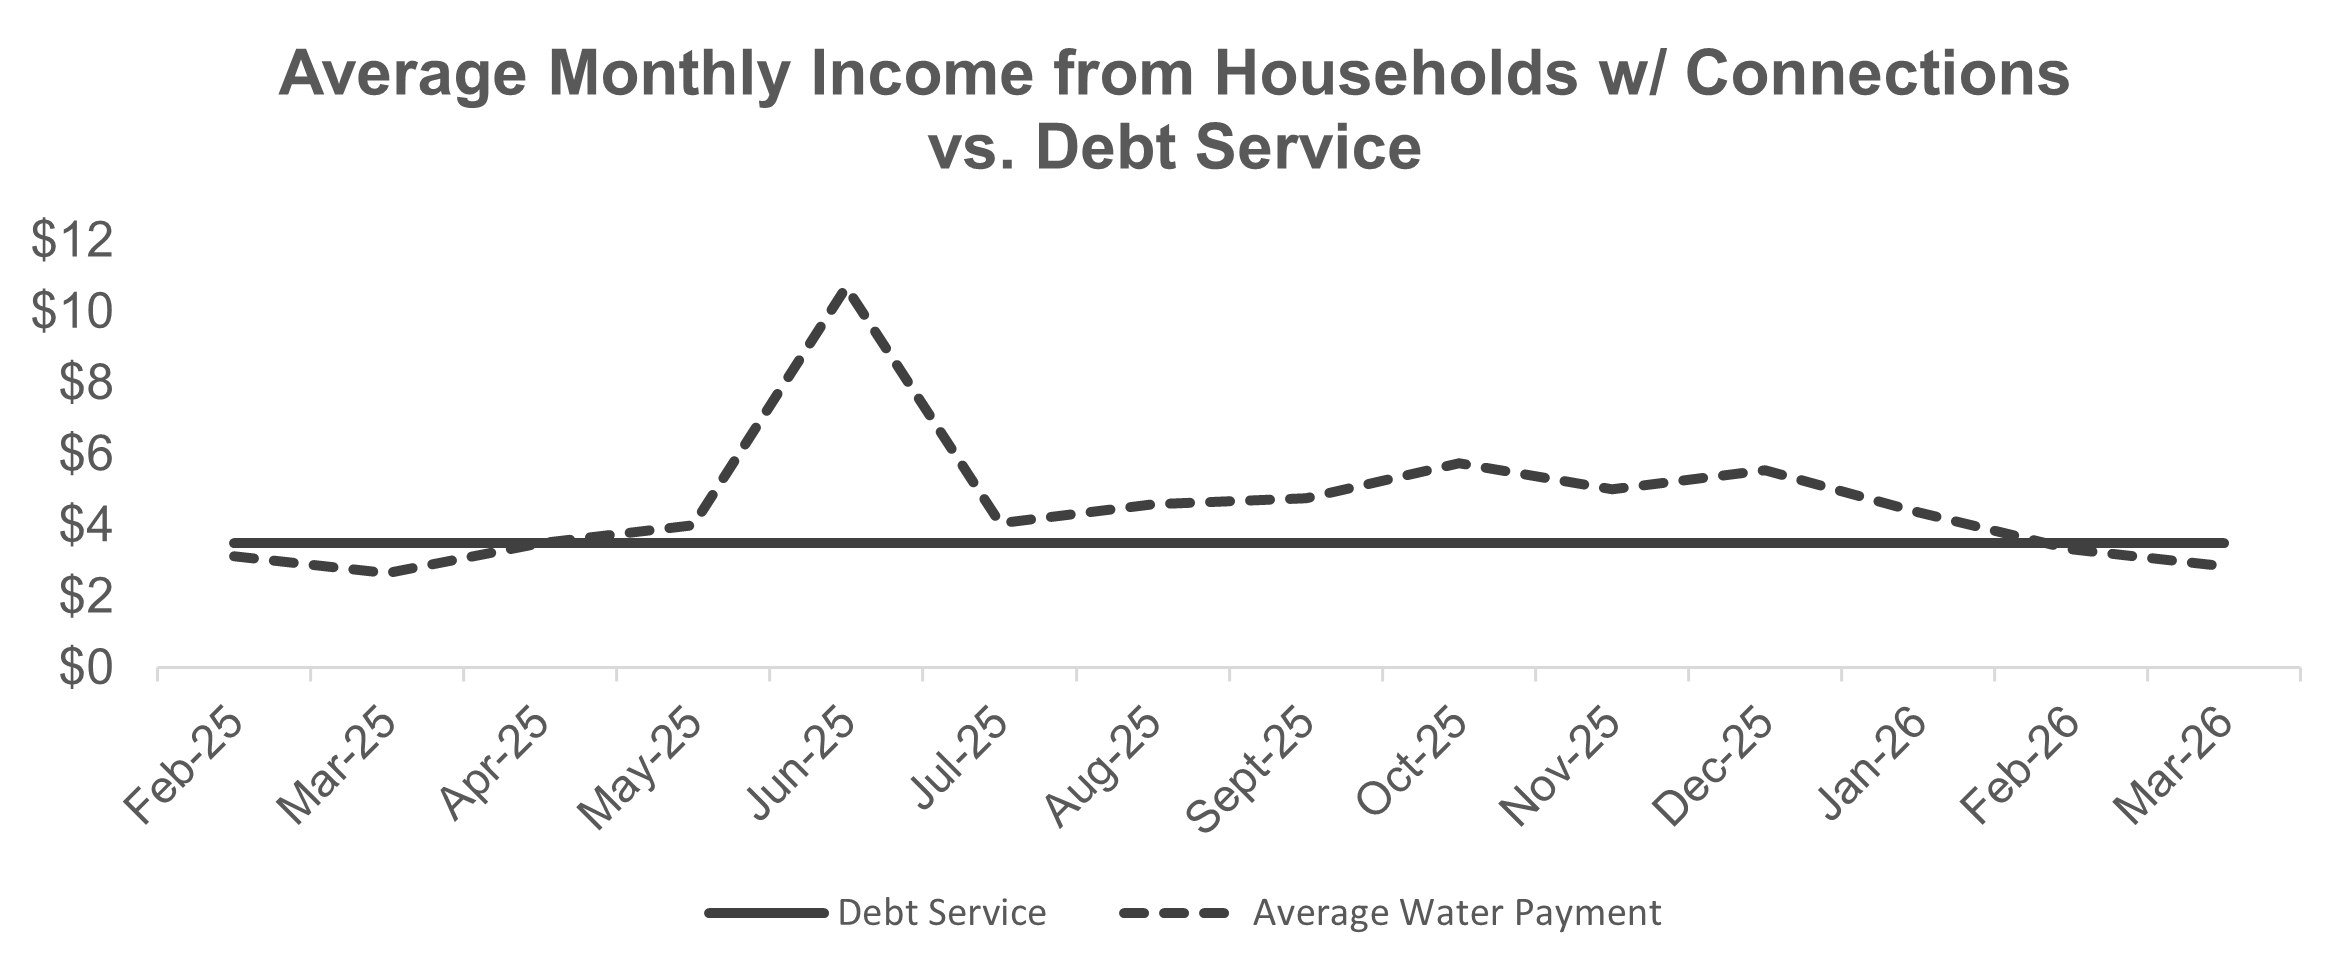
Household Connection Financing
It is also interesting to use the consumption data from these households to interpret the viability of our Household Connection Finance structure. The intention is to use loans to fund 85% of the high capital investment to have a household connection with a prepaid metre and that the debt service can be paid out of increased consumption.
The data here show that consumptions is still seasonal with household connections and that, during the heavy rainfall months, debt service is barely covered, leaving no surplus for the CBWSO. We will continue to monitor these data as we periodically revisit our proposed structure. The debt service is a function of the loan amount (% of capital expenditure funded by loan vs. by the household), interest rate and loan term.
This is tested for 8 pilot Household connections with Prepaid water meters. This is where we need to learn more from substancial number of HHC with prepaid water meters at least 400 HHC as the data from CHIUWE CBWSO from traditional meters (Postpaid) still shows high demand for both customers(HHC) and high water consumption compared to public taps.