February 2026 - Water Consumption
Our monthly reports show the latest trends in water consumption data and placing these in the context of the DMDO’s business model, which is to share in the revenue generated from the sale of water to cover its operating expenses and repay investment.
The report shows data from district to household.
Any questions or feedback, please contact me, Victor William, at victor80.vw@gmail.com.
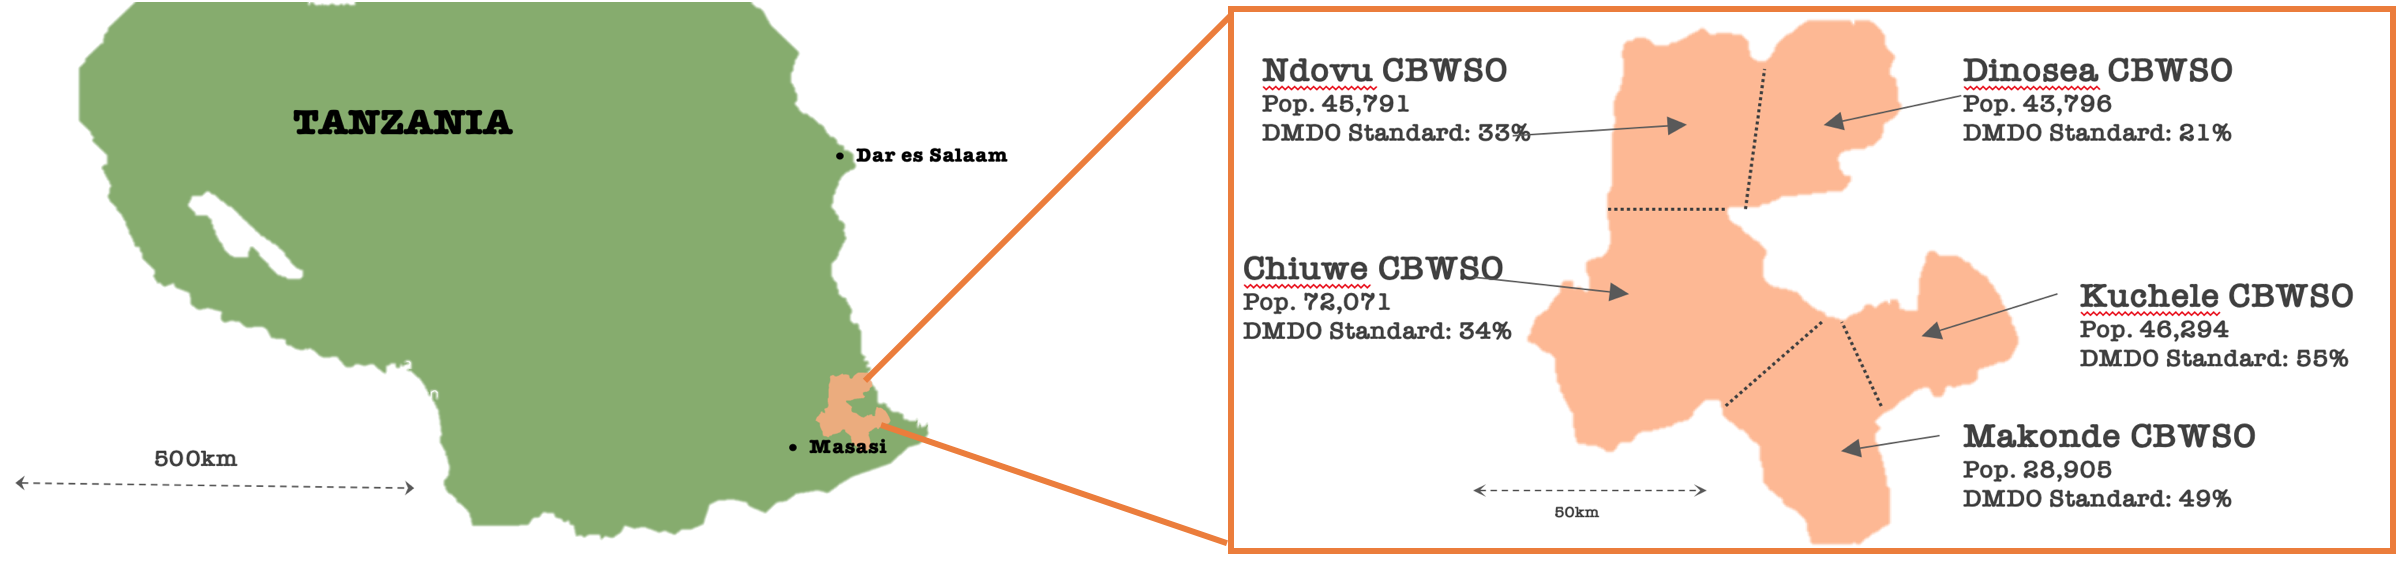
1. Lindi District Water Operator (CBWSO) Data
Financial Collaboration between Water Operators to support Capital Expenditures
There are some insights that I have seen that are interesting.
Kuchele CBWSO, together with RUWASA, took a bold step to improve their main water system (Navanga water system) that serves about 17,403 people with loan from other CBWSOs.
Their main challenge was at the water source where they shared the borehole with Lindi Municipal water utility. Therefore they decided to drill their borehole using the government machines, where they had to contribute the USD7,000 for drilling costs. This is where they borrowed USD4,000 from CBWSOs (USD2,000 from Makonde CBWSO and USD2,000 from Chiuwe CBWSO), RUWASA contributed USD2,000 and Kuchele CBWSO has budgeted for about USD1,000. They have drilled 184m productive borehole with the capacity of 50,000L per hour. They are planning to install the water pump in this month.
They expect to pay the loan from May to July as the consumption is expected to raise being the start of dry season.
What is see here is the ability of CBWSO to borrow from each other for high need capital investment or improvement of their water systems, this is under RUWASA supervision.
Also Makonde CBWSO in February spent about USD1,350 to improve Lipome water system where they have purchased 10,000L water tank to improve water storage and coverage as previously they had 5000L water tanks with one public DP (Prepaid), which has not been sufficient.
These activities are evidence that the consolidation of community water operators into larger, professional operators is bearing fruit.
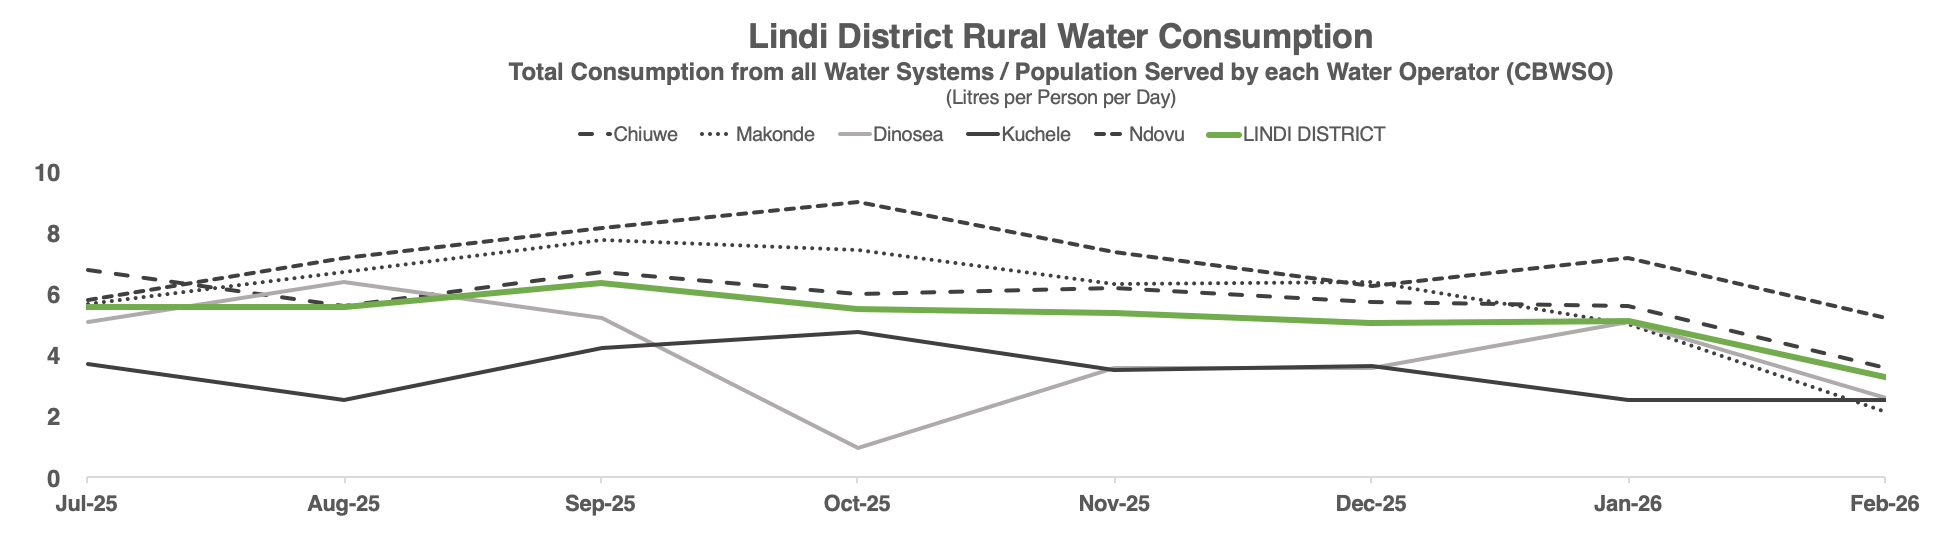
Lindi District Rural Water Consumption: Comments & Observations
There is a drop in consumption almost in all CBWSOs, the main reasons being high rainfall and most of the people going for farming.
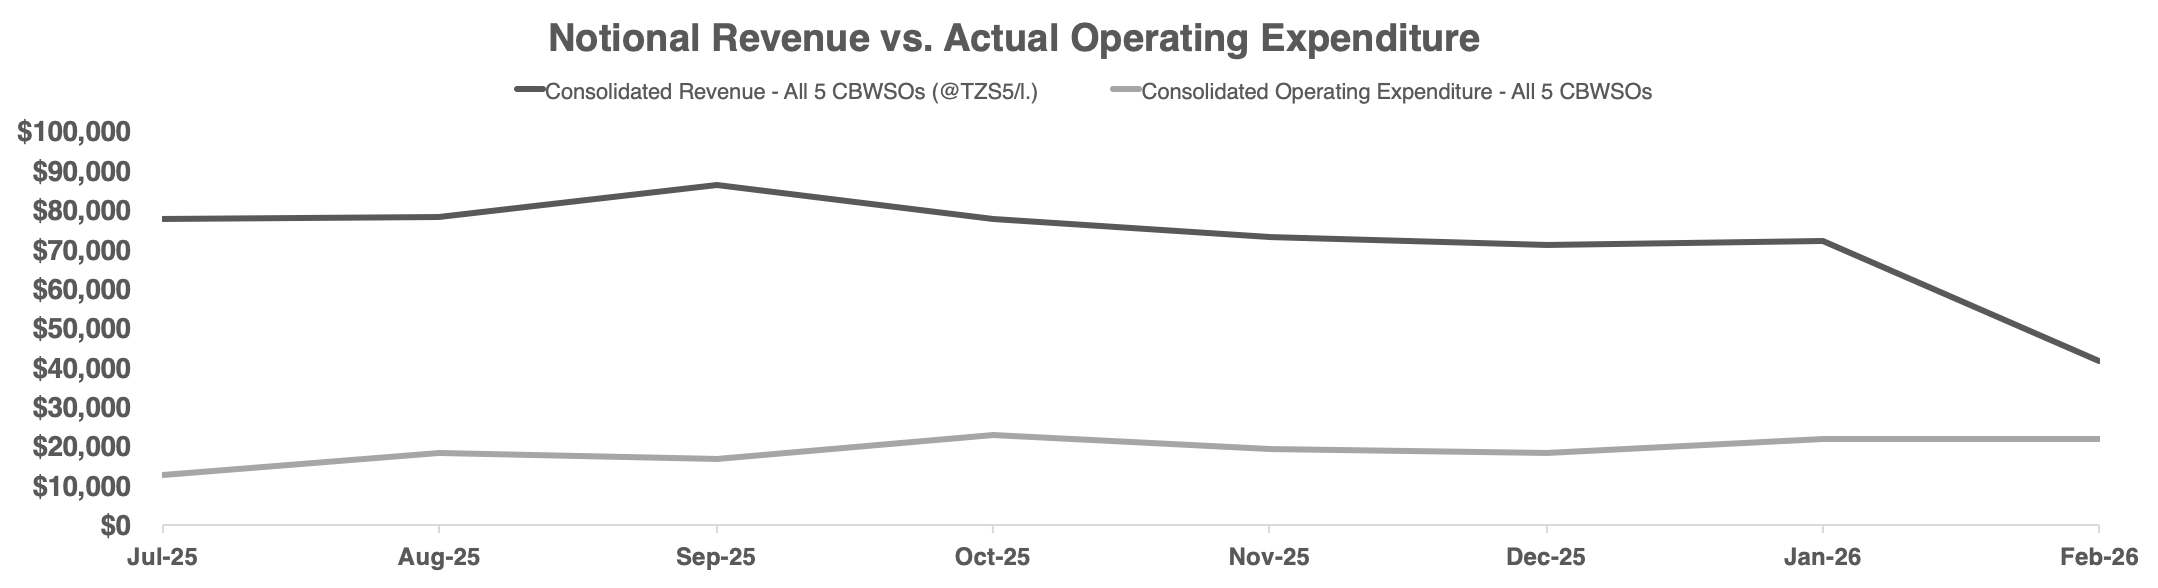
Notes on Water Operator Revenue vs. Operating Expenditure
Revenue not ‘actual’ - calculated by litres consumed x TZS5 / litre.
TZS5 / litre is not current price but the affordable price that DMDO business model relies on.
DMDO business model assumes suplus used for:
Water Operator service improvement;
DMDO (a.k.a. Rural Water Intermediary) Operating Costs; and
Return-Seeking Investor in Water Supply Infrastructure.
Current Problem is Low Price and Revenue Loss
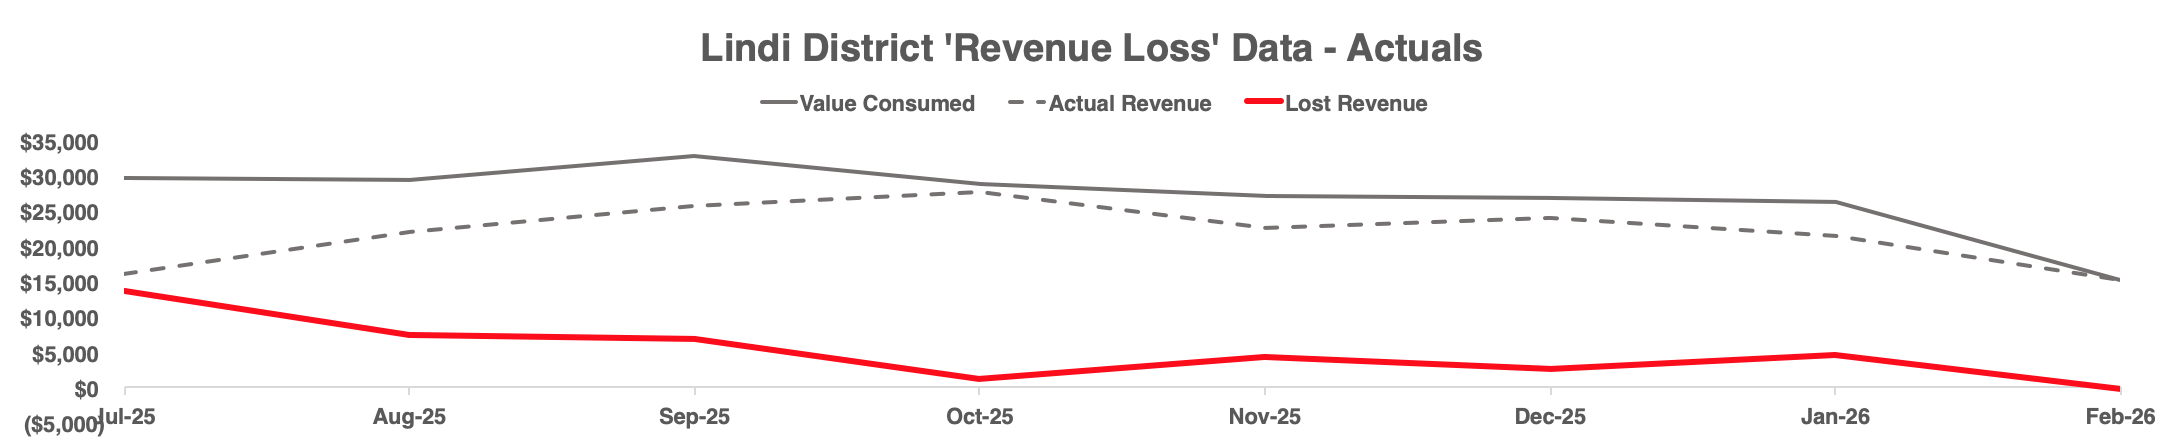
Digitisation of Water Supply (through Prepaid Metres) addresses Revenue Loss problem.
2. DMDO Footprint Data
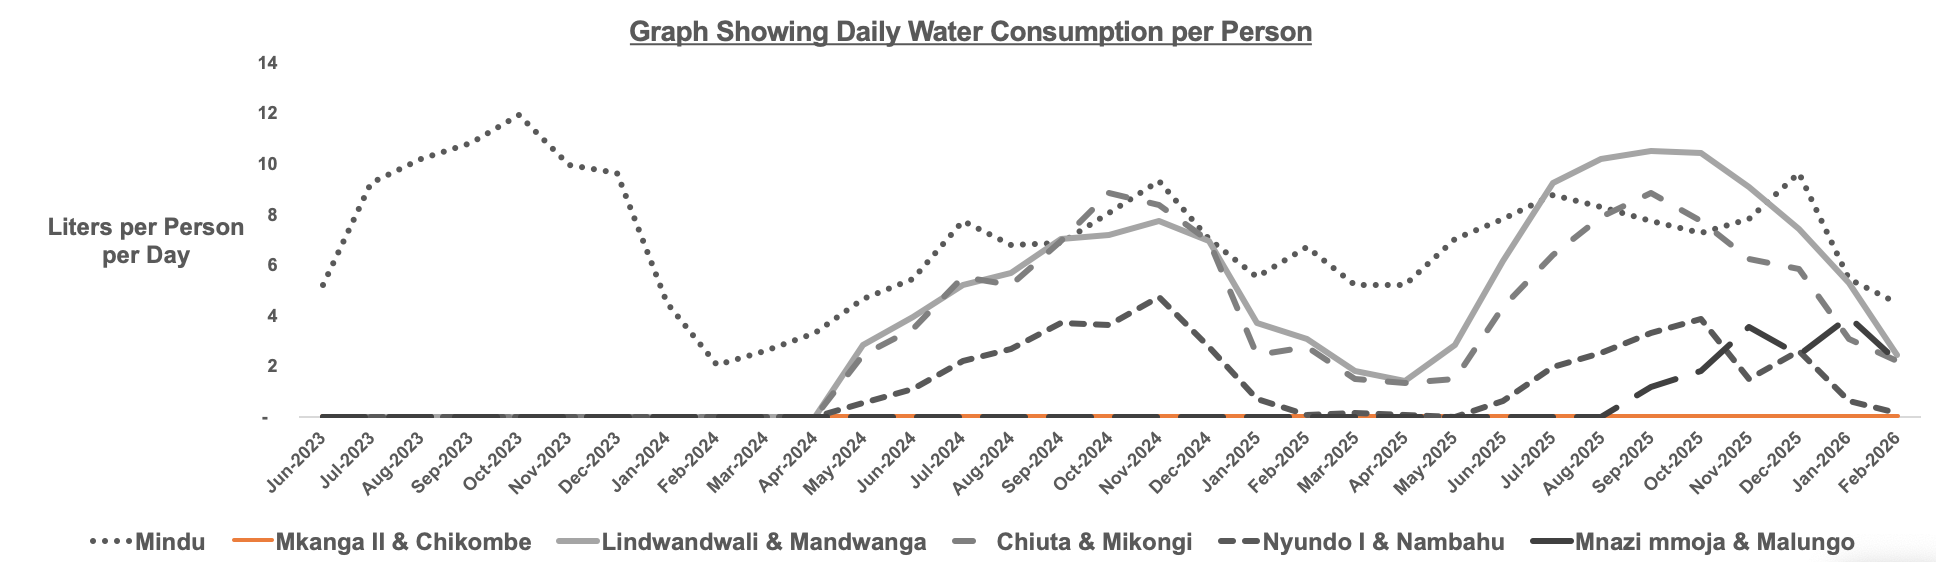
DMDO Footprint Data - Comments & Observations
Lindwandwali & Mandwanga Water System - The consumption of piped water has done down due to heavy rainfall, that majority are consuming rain water and are spending less time at home for farming.
Nyundo 1 & Nambahu Water System - Majority opts for rain water as the piped water is salty. The DMDO is in the final processes improving water quality by using Mikongi water source, which has fresh water.
Chiuta & Mikongi Water System - the system power supply (needed to supplement our solar power due to high required pumping hours) has been stable (improvement from January) with reliable supply of water. The consumption has gone down due to majority dependence of rain water and spending most of the time in farms
Mnazimoja & Malungo Water System: Even though piped water is new to these villages, with heavy rainfall there is no high drop in consumption. Community members are now getting familiar to piped water.
Mindu Water System: seasonal rainfall still reduces piped water consumption.
3. Household Connection Data
The DMDO has installed prepaid meters at 8 households in 4 villages within 3 Water Systems. These are pilots to show that consumption is much higher in household connections and that this supports a financial product in which the household connection can be financed and that debt serviced out of revenue from increased consumption.
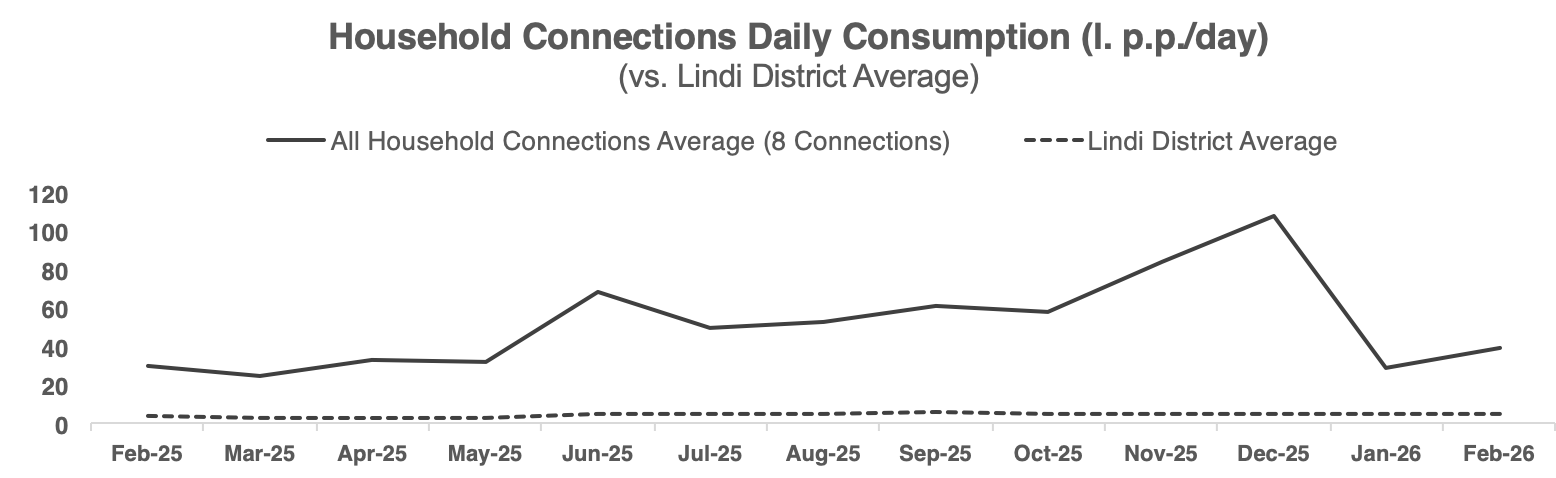
Household Connection Data - Comments & Observations
There is a drop in HH water consumption of piped water in February compared to previous months due to very high rainfall. The average of about 20 litres per person per day is very high comparing to the ones using public taps which is at the average of 2 litres per day per person . Therefore, HH connection still shows high water consumption compared to accessing water from public taps.
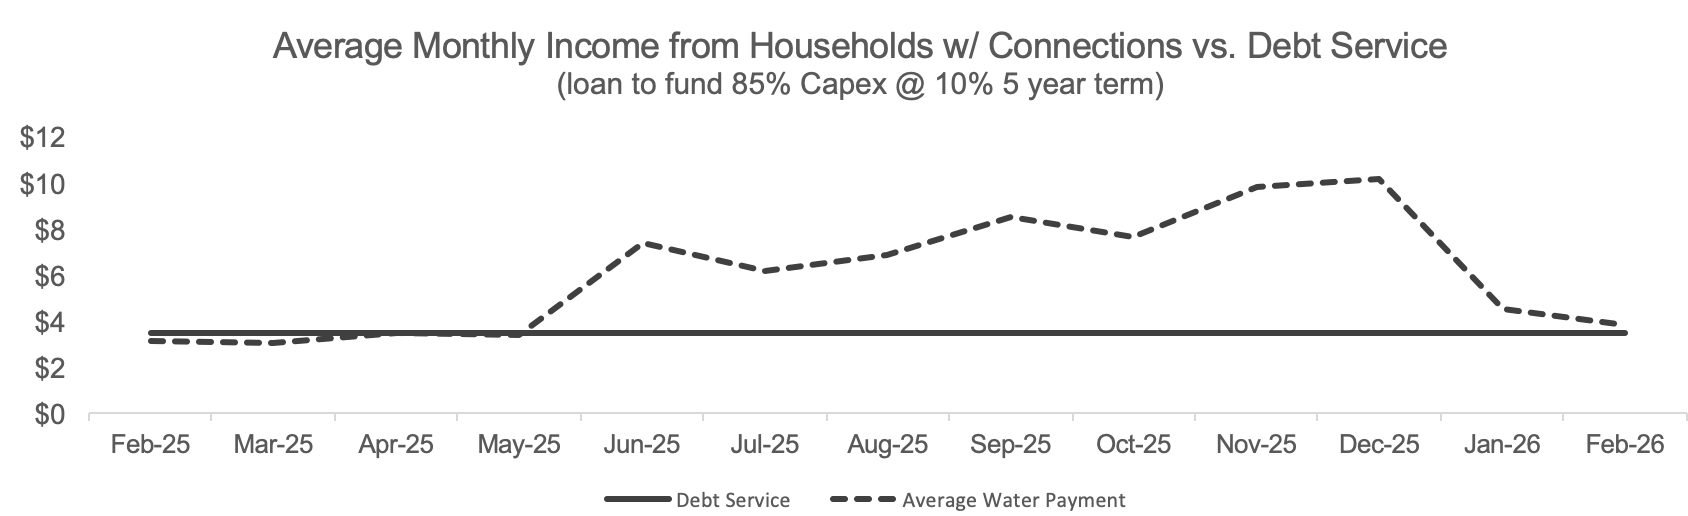
Household Connection Financing
It is also interesting to use the consumption data from these households to interpret the viability of our Household Connection Finance structure. The intention is to use loans to fund 85% of the high capital investment to have a household connection with a prepaid metre and that the debt service can be paid out of increased consumption.
The data here show that consumptions is still seasonal with household connections and that, during the heavy rainfall months, debt service is barely covered, leaving no surplus for the CBWSO. We will continue to monitor these data as we periodically revisit our proposed structure. The debt service is a function of the loan amount (% of capital expenditure funded by loan vs. by the household), interest rate and loan term.