
Our monthly reports show the latest trends in water consumption data and placing these in the context of the DMDO’s business model, which is to share in the revenue generated from the sale of water to cover its operating expenses and repay investment.
The report shows data from district to household.
Any questions or feedback, please contact me, Victor William, at victor80.vw@gmail.com.
1. Lindi District Water Operator (CBWSO) Data
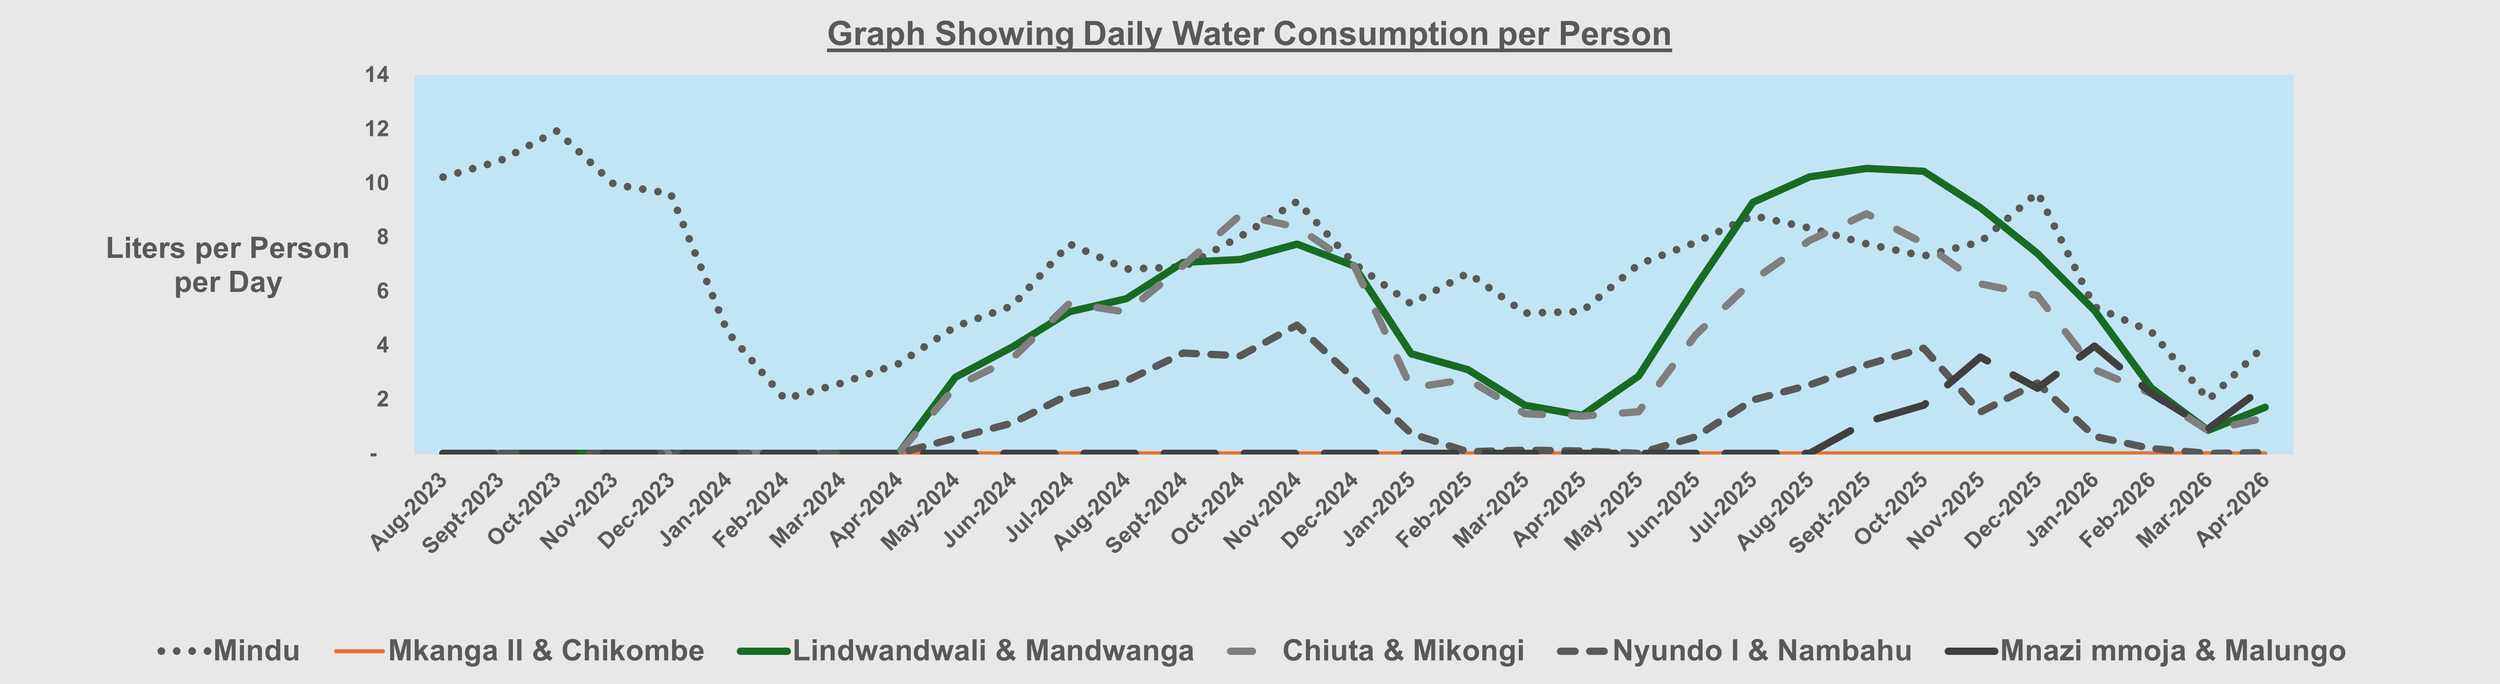
Piped Water Consumption in relation to weather condition in Lindi:
Key Insights
The April report shows a slight increase in piped water consumption compared to March.
Communities in Lindi and Mtwara experienced higher and more prolonged rainfall during this year’s rainy season.
April marks the end of the rainy season in southern Tanzania. During this period, some weeks experienced several consecutive days without rainfall.
While rainfall was frequent, many households relied mainly on rainwater for daily domestic use instead of piped water.
However, the traditional practice of storing rainwater for long periods, including for use during the dry season, appears to be declining.
Most households now store rainwater only for short-term daily use, and many runoff water harvesting storage tanks are no longer actively used.
As a result, when rainfall stops for more than three to four days, households quickly return to using piped water sources.
2. DMDO Footprint Data
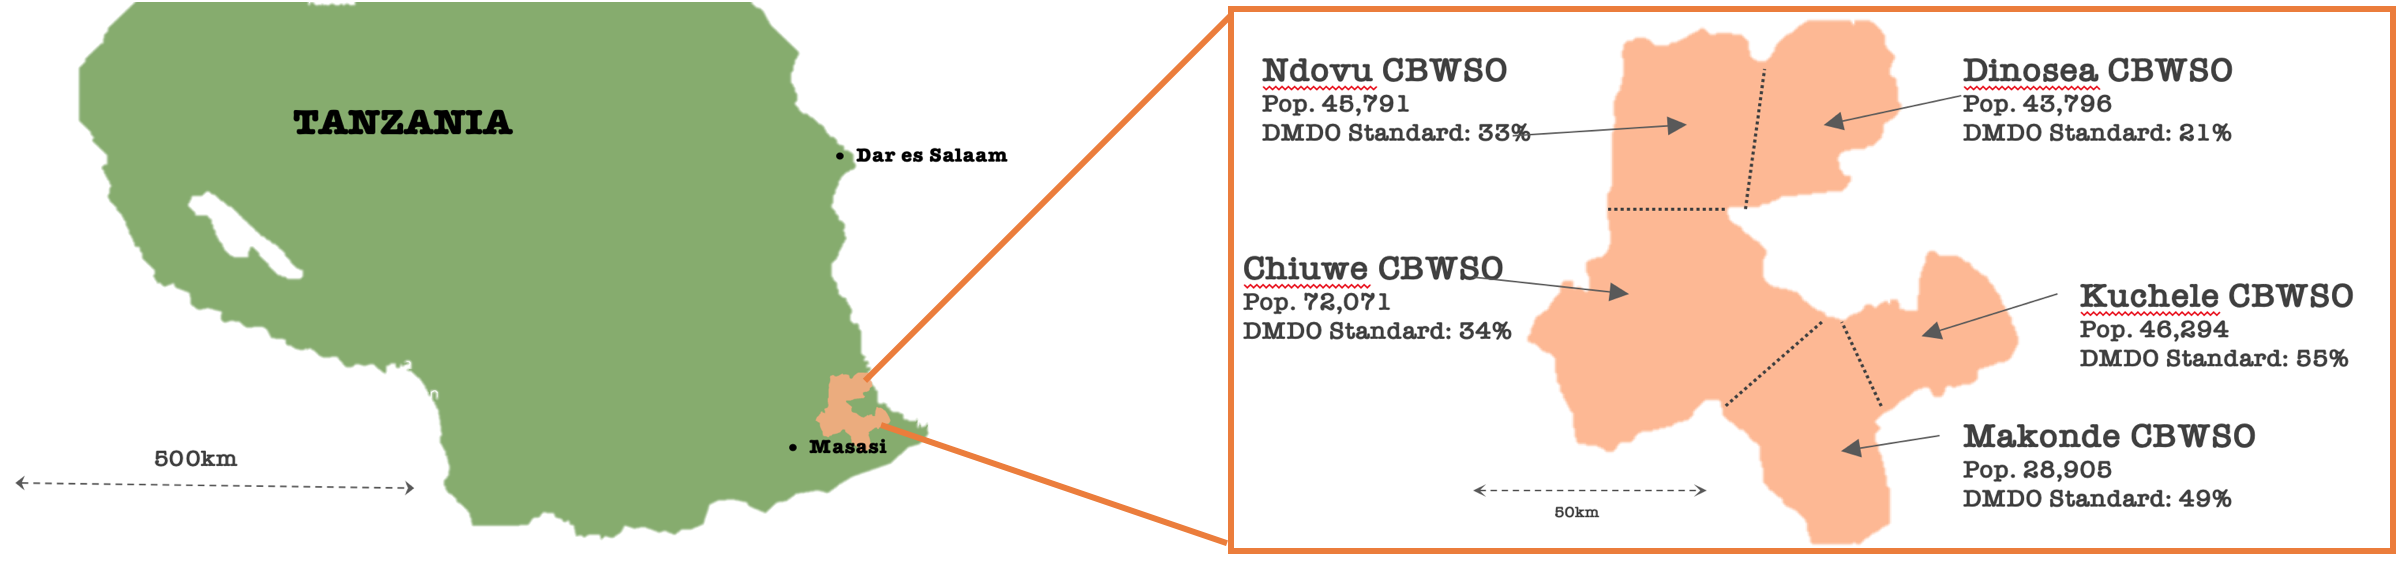
DMDO Footprint Data - Comments & Observations
The DMDO in partnership from World Vision Tanzania with Funds from The Grille Foundation has invested water systems to DMDO standards that is “Basic access to clean, safe, and reliable water services delivered through digitised infrastructure.”
DMDO water systems monthly consumption: Comments & Observations
April is the last month of the rainy season in southern Tanzania. During this period, some weeks experienced several days without rainfall.
As rainfall reduced, more households returned to using piped water.
A change in rainwater harvesting behavior was also observed.
Many households no longer store rainwater for long periods. Most collect rainwater only for daily use when it rains.
This practice is more common among households without direct water connections
3. Household Connection Data
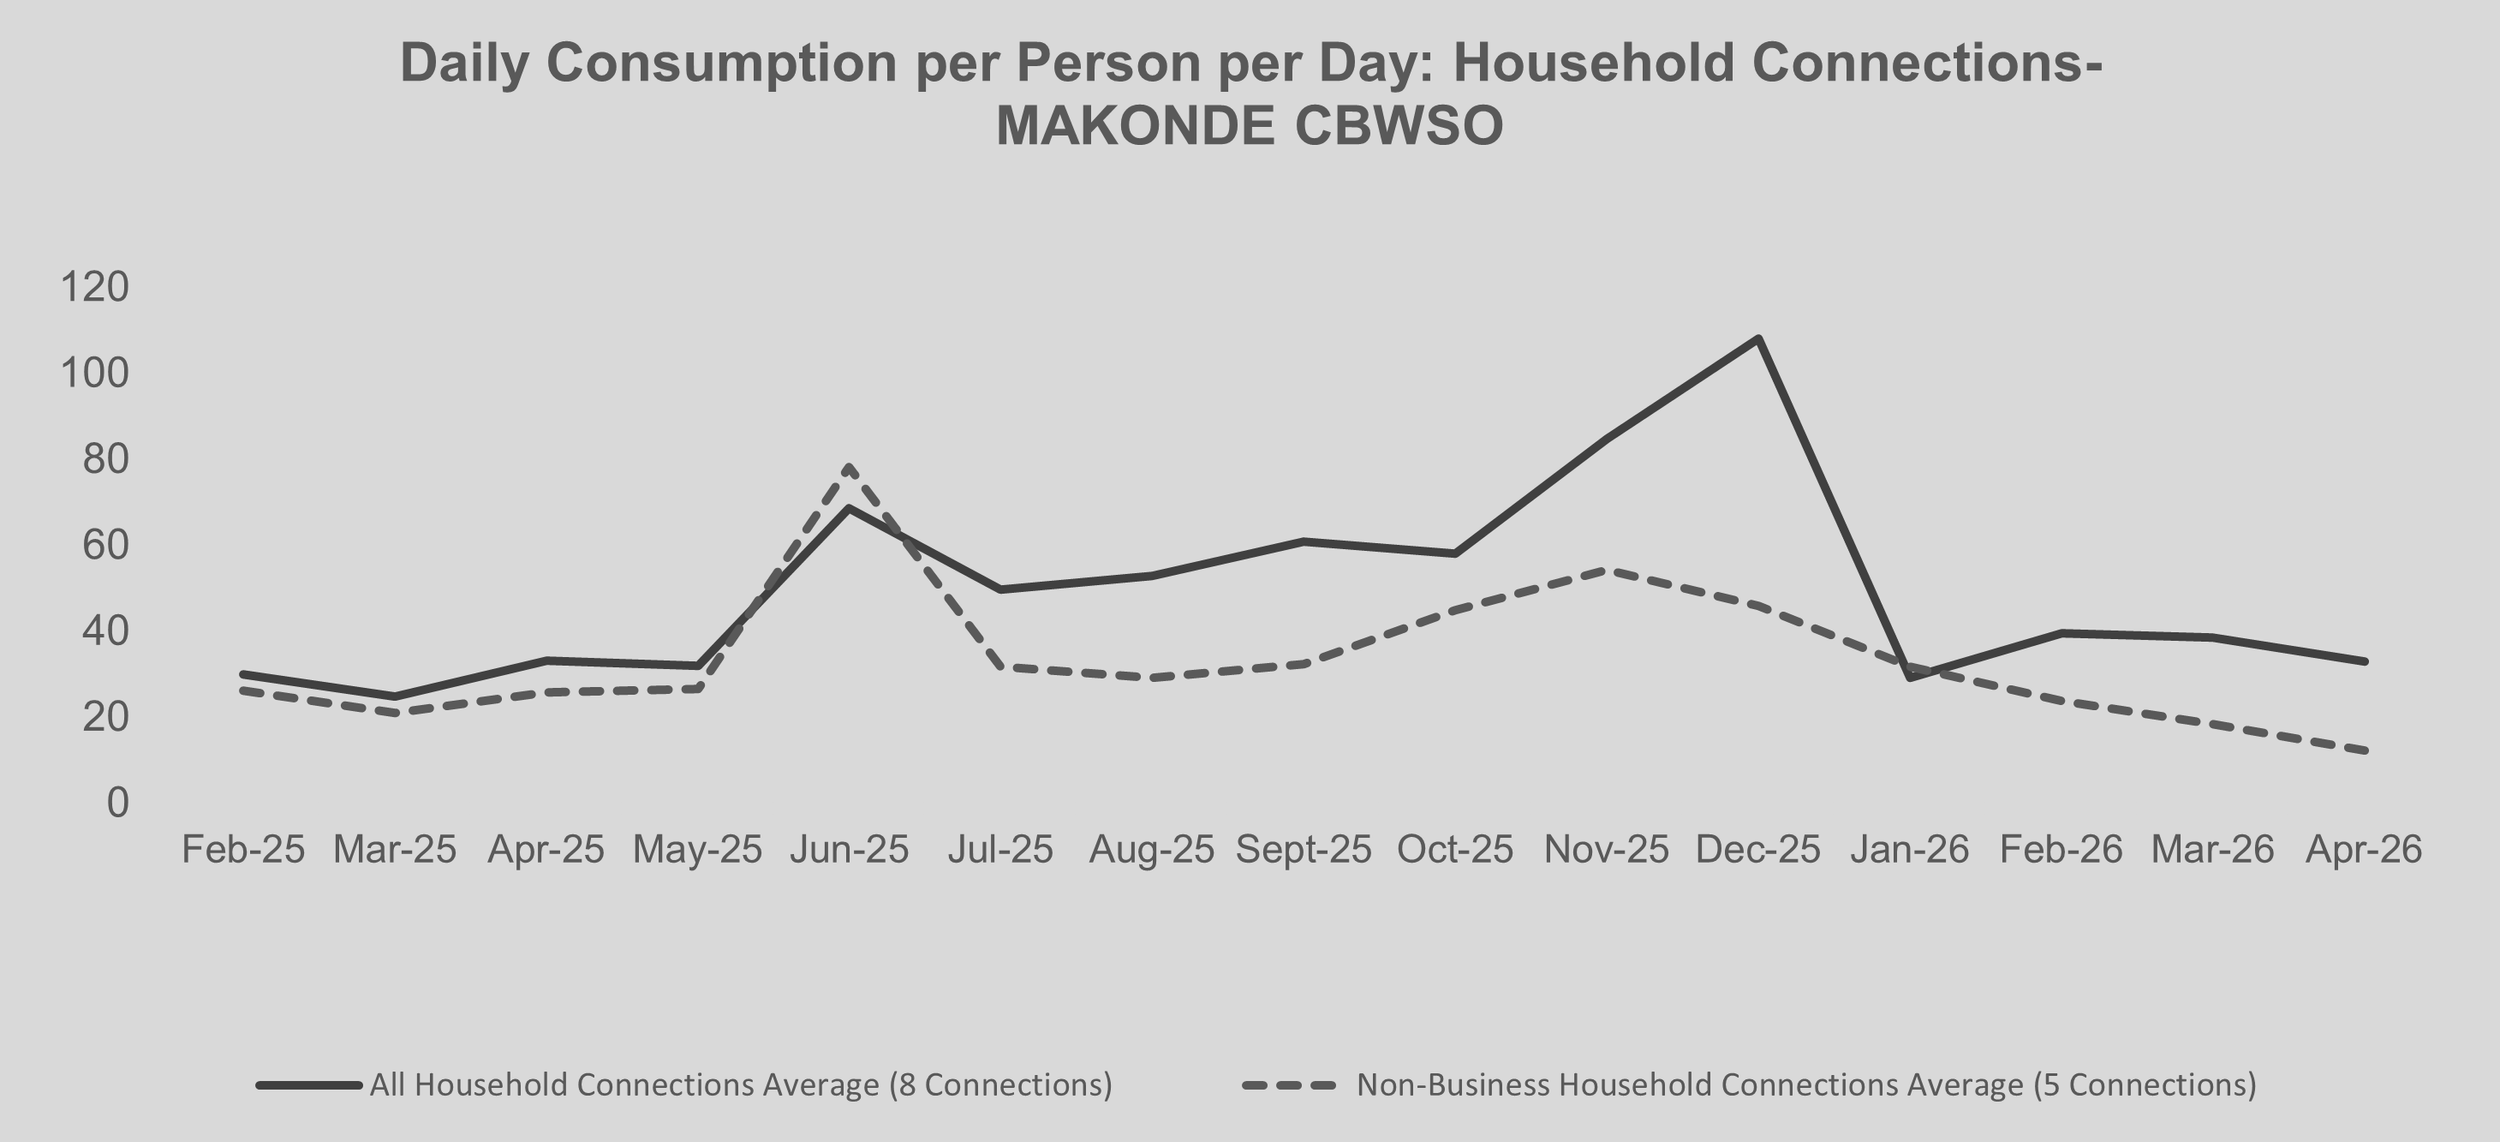
The DMDO has installed prepaid meters at 8 households in 4 villages within 3 Water Systems. These are pilots to show that consumption is much higher in household connections. This supports a financial product in which the household connection can be financed and that debt serviced out of revenue from increased consumption.
Household Connection Data - Comments & Observations
While there is s slight drop on consumption per person , HHC still records higher consumption of piped water compared to majority accesisng from public distribution points
The general average is about 30Lts per person which is above 12Ltrs for non business and very higher than around 3Ltrs per day per person for people accessing water from the public taps.
This informs that people with household water connections (Water at the doorstep) have high likelihood of using more piped water that those depending on public distribution points which demands them to travels up to 200meters to get water.
Remarks:
Communities are changing their rainwater storage practices. In the past, many households stored rainwater for long periods, which sometimes created health risks. Currently, most households collect rainwater mainly for daily use during rainy days. After two to three days without rain, they return to using piped water, especially when the supply is reliable.
This trend shows the growing importance of investing in reliable water supply systems. As communities continue to build trust in piped water services, water demand and consumption are likely to increase over time. Reliable water supply has positive implications for public health, financial sustainability of water investments, and overall community prosperity.
