January 2026 - Water Consumption
Our monthly reports show the latest trends in water consumption data and placing these in the context of the DMDO’s business model, which is to share in the revenue generated from the sale of water to cover its operating expenses and repay investment.
The report shows data from district to household.
Any questions or feedback, please contact me, Victor William, at victor80.vw@gmail.com.
1. Lindi District Water Operator (CBWSO) Data
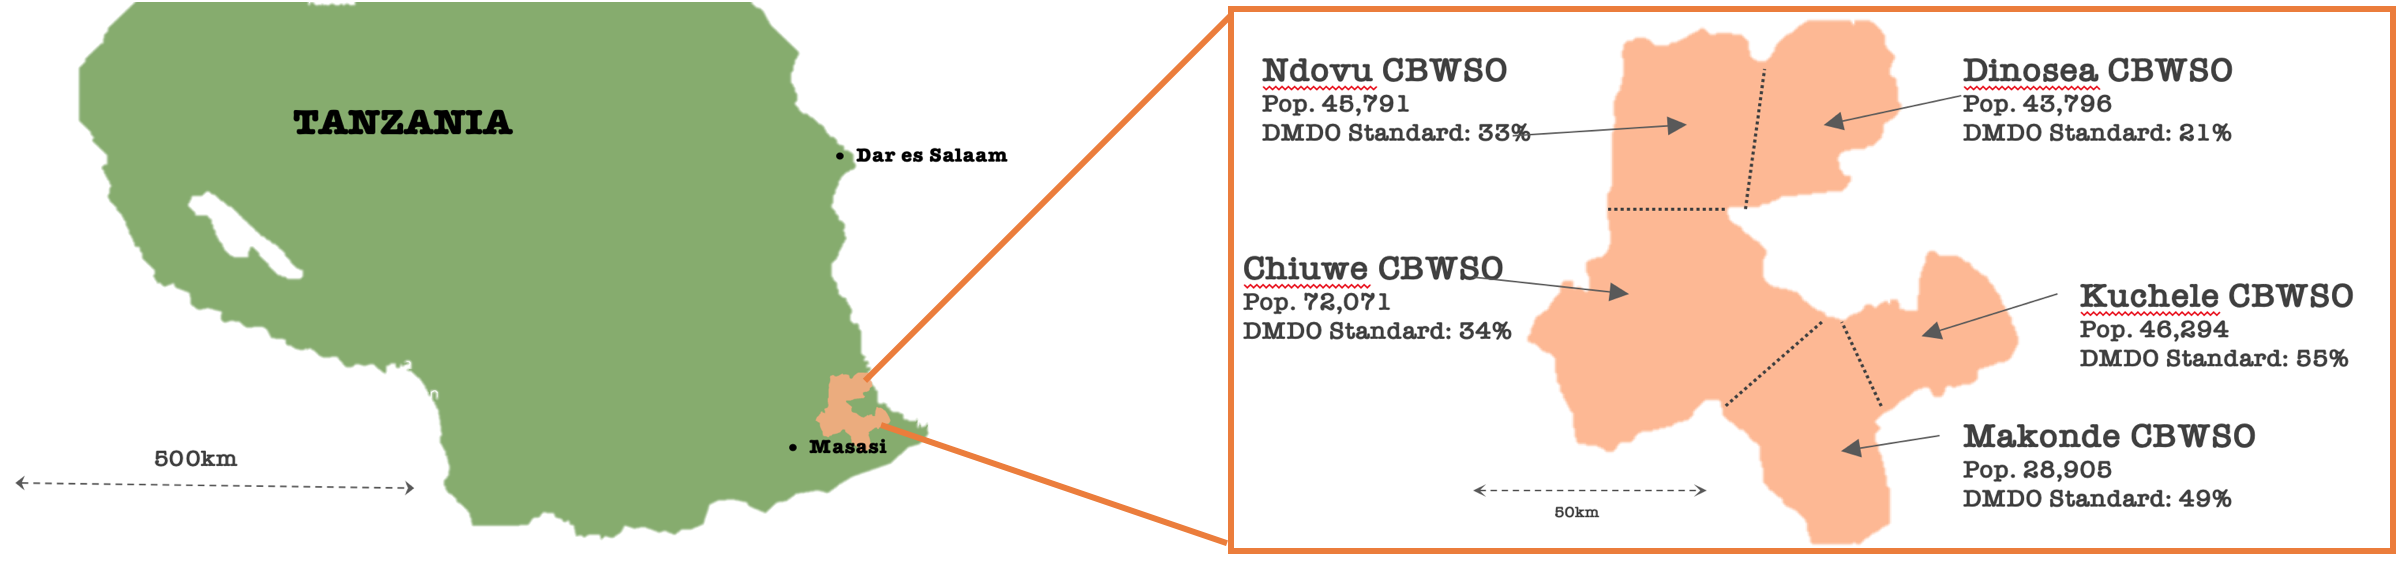
Data start from month in which Water Operators were consolidated
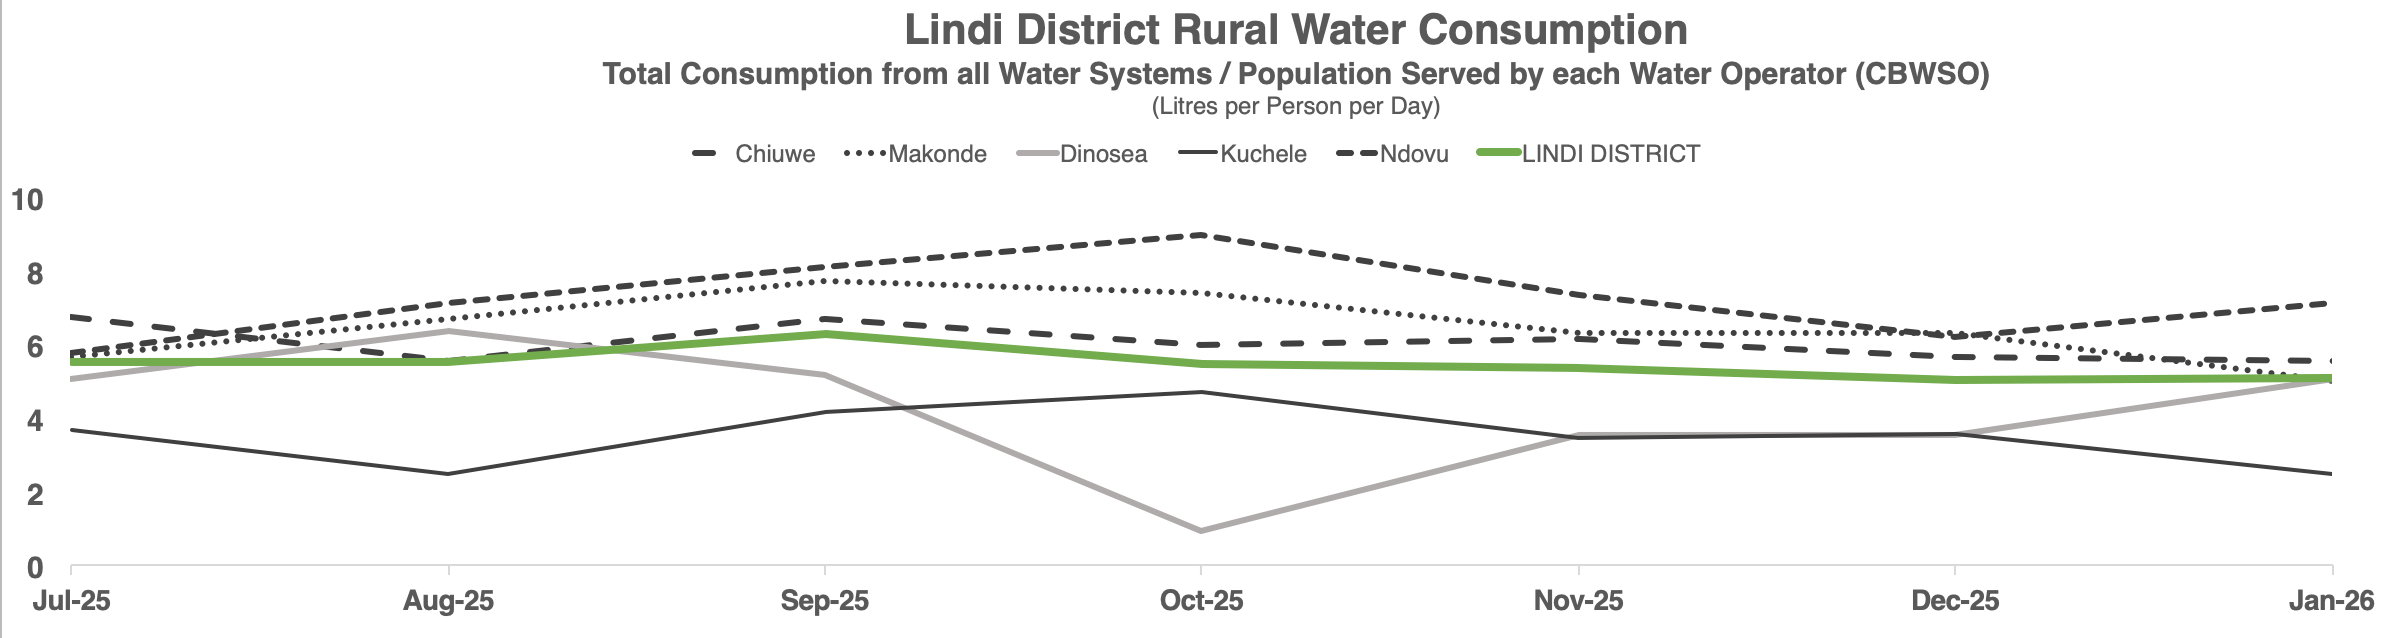
Lindi District Rural Water Consumption: Comments & Observations
Some water systems in Chiuwe rely on electricity from the public grid. This electricity faced challenges in January, which is why water consumption is down. The DMDO Standard places emphasis on solarisation to avoid relying on the vagaries of the electric grid. (Our own hybrid power system in Chiuta has been similarly effected - see below.)
Dinosea had low rain in January.
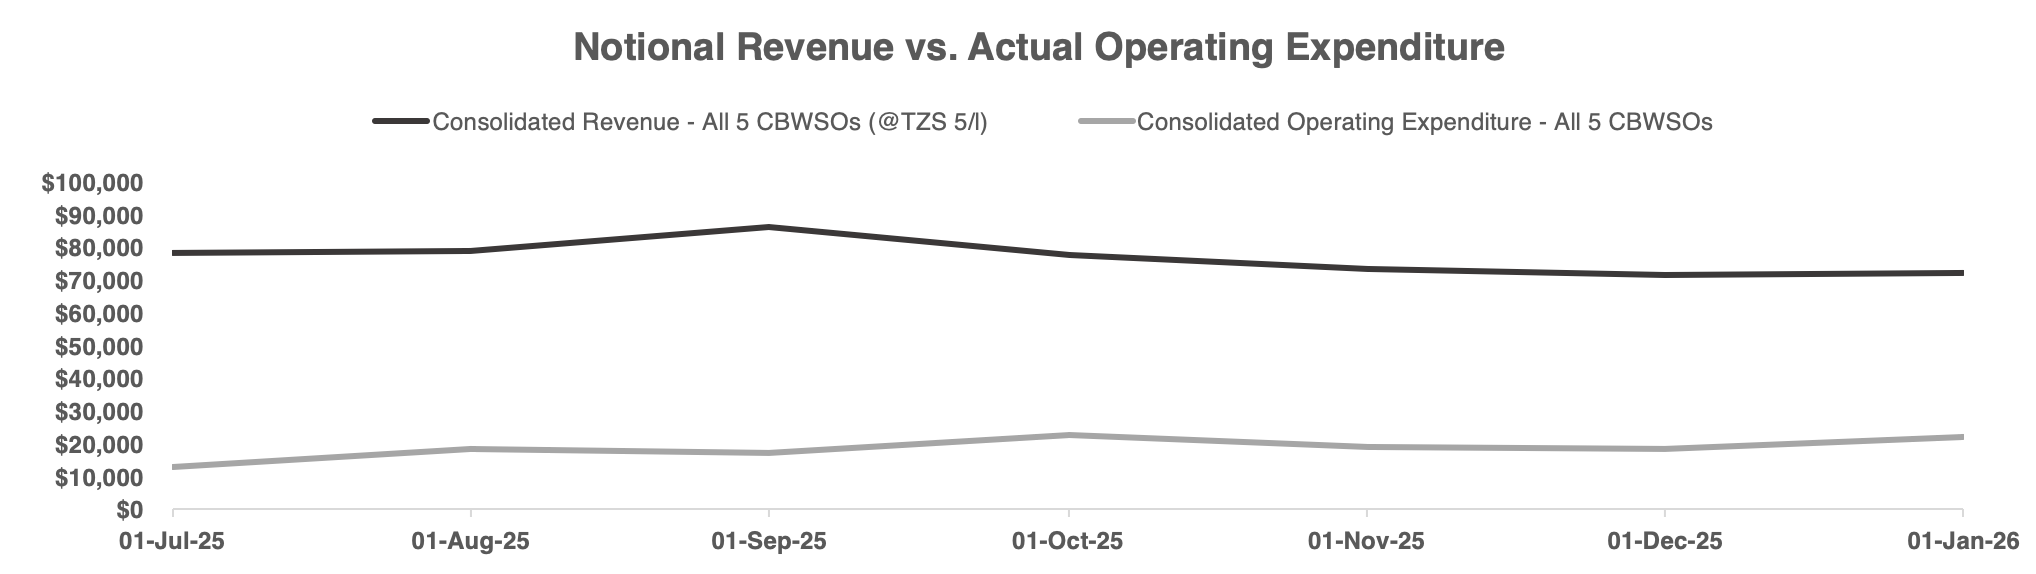
Note: Consolidated CBWSO Operating Expenditure slightly higher because Chiuwe CBWSO had exceptional expenditure (repair the electricity system and attending a 5-day training).
Notes on Water Operator Revenue vs. Operating Expenditure
Revenue not ‘actual’ - calculated by litres consumed x TZS5 / litre.
TZS5 / litre is not current price but the affordable price that DMDO business model relies on.
DMDO business model assumes suplus used for:
Water Operator service improvement;
DMDO (a.k.a. Rural Water Intermediary) Operating Costs; and
Return-Seeking Investor in Water Supply Infrastructure.
Current Problem is Low Price and Revenue Loss
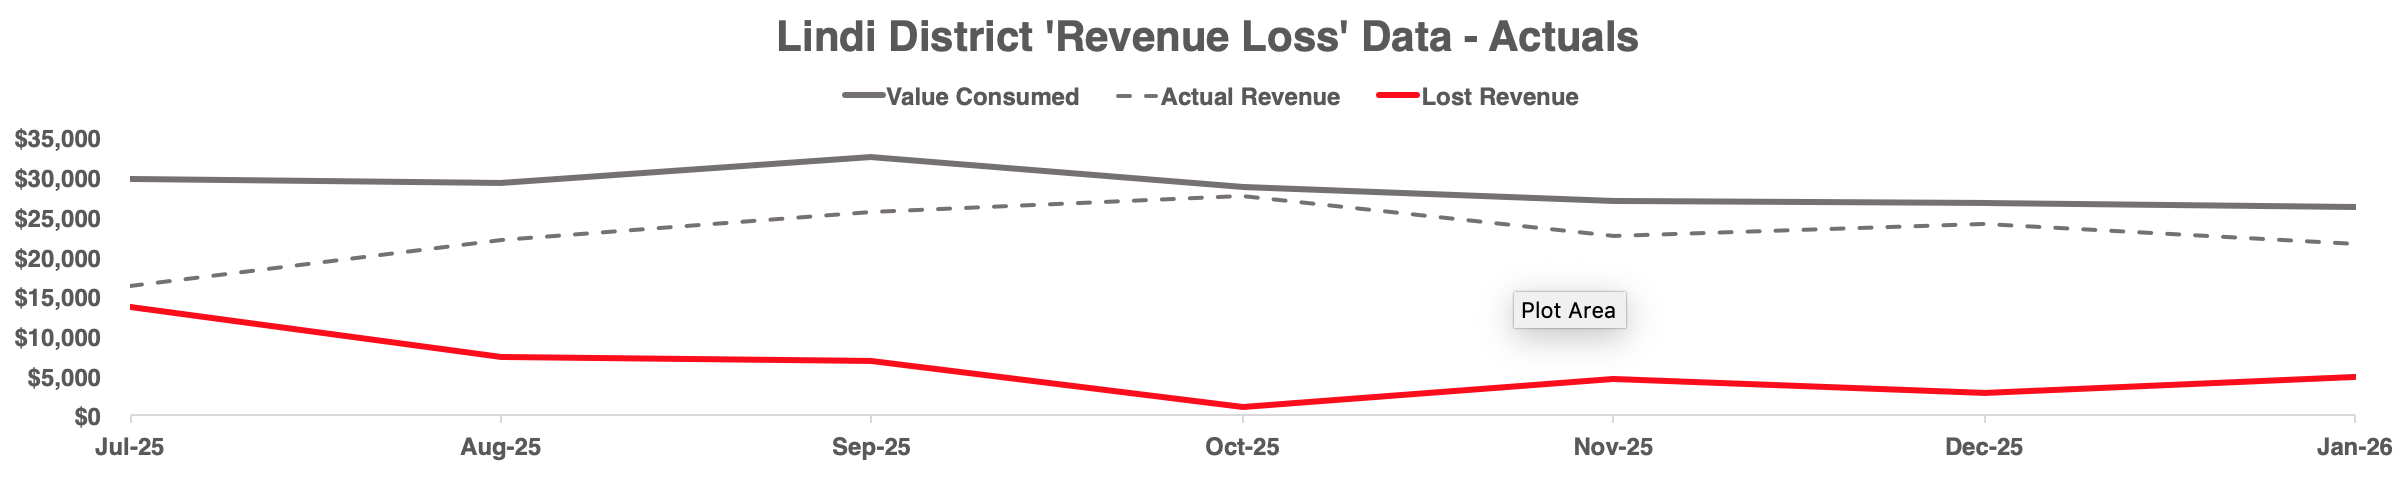
Digitisation of Water Supply (through Prepaid Metres) addresses Revenue Loss problem.
2. DMDO Footprint Data
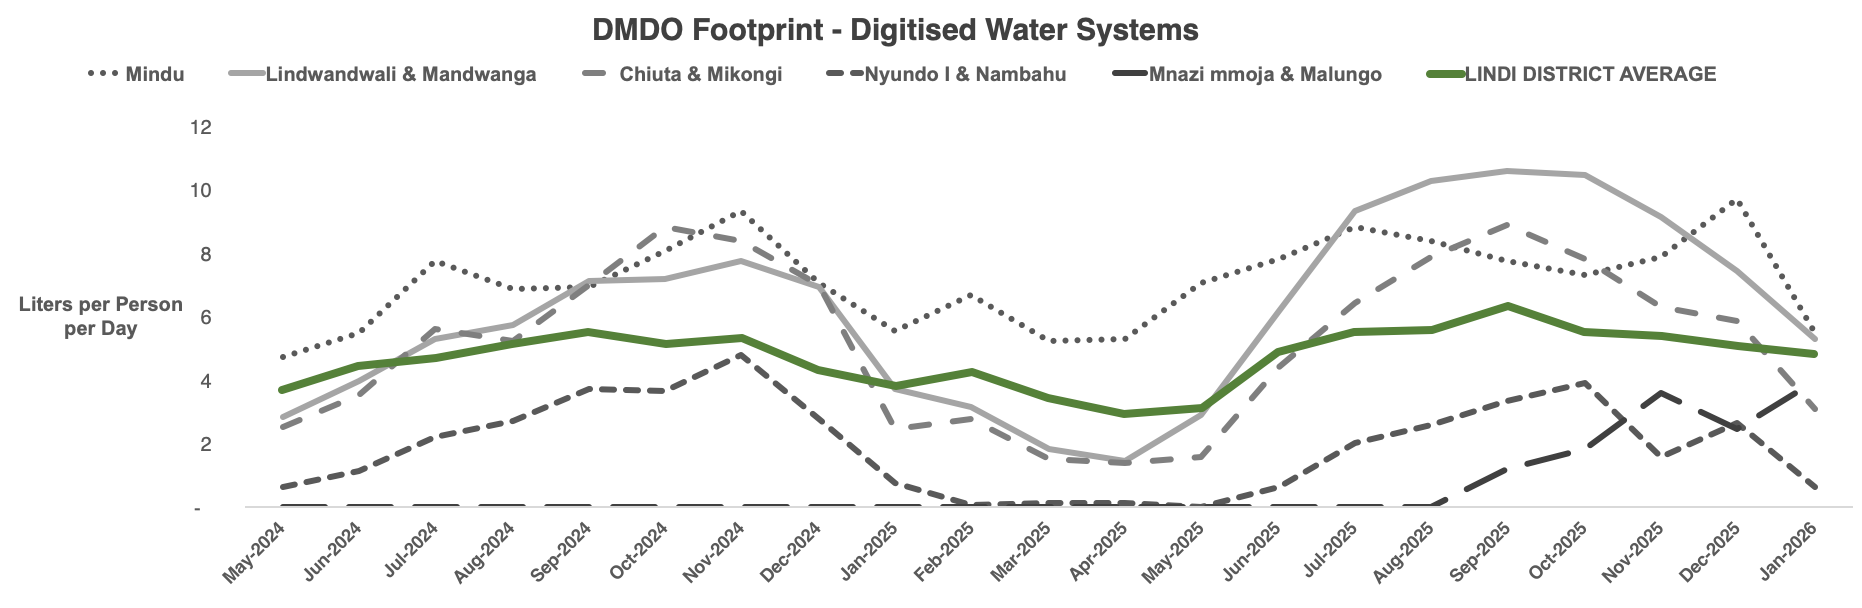
DMDO Footprint Data - Comments & Observations
Lindwandwali & Mandwanga Water System - has had encouraging year-on-year increase in consumption over the last 6 months. We think this is because the system has provided reliable water supply. This has meant that the majority of households did not repair their rainwater harvesting tanks, which would previously have been a competing source of water.
Nyundo 1 & Nambahu Water System - this is right down. We think this is because of a combination (a) salty piped water and (b) very high rainfall providing alternative water source.
Chiuta & Mikongi Water System - electricity instability in January. We used hybrid (solar and electric grid) power because daytime pumping hours do not meet the demand. Electricity is used at night to refill tanks. Electric grid instability therefore affected availability and this affected consumption.
Mnazimoja & Malungo Water System: Newly completed systems show increasing consumption, indicating gradual community transition to safe water services.
Mindu Water System: Very high rainfall. No technical issues.
3. Household Connection Data
The DMDO has installed prepaid meters at 8 households in 4 villages within 3 Water Systems. These are pilots to show that consumption is much higher in household connections and that this supports a financial product in which the household connection can be financed and that debt serviced out of revenue from increased consumption.
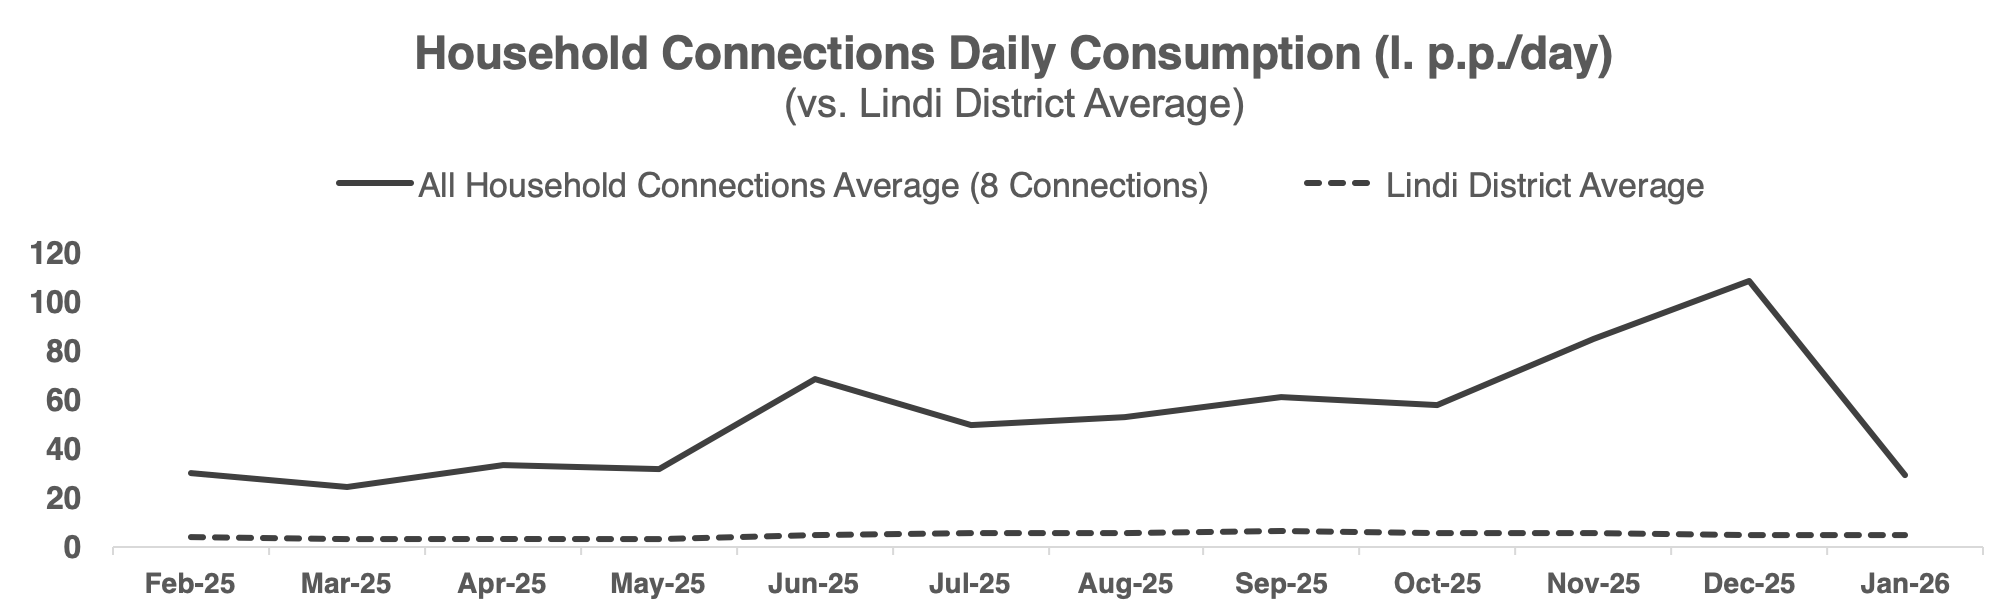
Household Connection Data - Comments & Observations
The graph suggests that consumption was unusually high in December and unusually low in January. In fact, the line is a proxy for consumption and actually represents payments. In December, Yusta Ngonyani in Chiuta village bought 50,000 litres for her household of three people and did not buy any water in January. After receiving her cashew payments she decided to buy credit for her household water to ensure that the household had water paid for for the coming months before other claims on the cash intervened.
As a general rule, households like to have an excess balance (though perhaps not this big) because topping up your credit at short notice can mean dealing with temporary internet network issues.